Get a clear read on daily lab throughput every night
Every night, WebRun opens Ocuco Innovations, tallies jobs started, finished, shipped, and remade for the day along with cycle times by stage, appends the totals to a Google Sheet for trend history, and posts your managers a Slack throughput report comparing the day to recent averages.
- No credit card
- Under $0.01 per run
- Cancel anytime
How do I automatically report daily optical lab throughput?
WebRun tallies the day's jobs started, finished, shipped, and remade in Ocuco Innovations each night, with cycle times by stage. It logs the totals to a Google Sheet and posts your managers a Slack throughput report comparing the day to recent averages, so output and remake rate are clear every morning without a manual count.
- Managers open Slack to the day's output and remake rate every morning with no manual tally
- Throughput and cycle-time trends build automatically in a Google Sheet
- A dip in output or a spike in remakes is visible against recent averages the same night
Built for optical lab managers · wholesale lens labs · operations managers · lab owners
What does WebRun do on every run?
The exact actions WebRun takes, in order - in plain language, so you can adjust anything.
-
WebRun signs in and gets to work
Opens
www.ocuco.comin a real browser with your saved login - no setup, no API keys. -
1
Ocuco Innovations - tally the day's production
ocuco.com How to Automate Ocuco Innovations
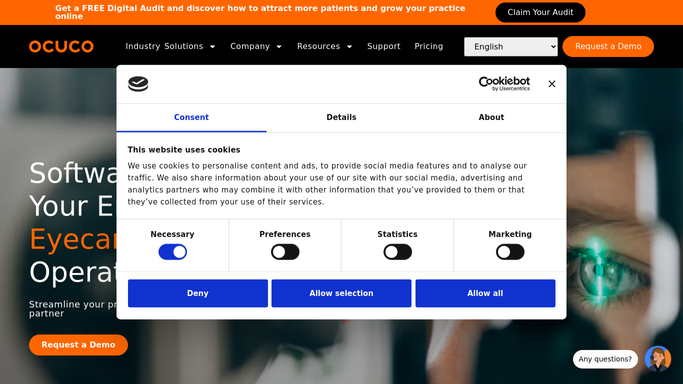
WebRun opens Ocuco Innovations to tally the day's production. - Open Ocuco Innovations and pull the day's production figures
- Count jobs started, finished, shipped, and remade for the day
- Capture average cycle time overall and by stage such as surfacing, coating, and edging
- Note the count of jobs still open and any that are past their promised date
Done when The day's started, finished, shipped, and remade counts plus cycle times are captured.
-
2
Google Sheets - log daily throughput history
google.com How to Automate Google Sheets

WebRun opens Google Sheets to log daily throughput history. - Open the Daily Throughput sheet
- Append one row for the day with every metric captured, avoiding a duplicate for a day already logged
- Update the rolling weekly and monthly averages
- Keep the sheet sorted so the newest day is easy to find
Done when Today's throughput row is logged and rolling averages are updated.
-
3
Slack - post the throughput report
slack.com How to Automate Slack

WebRun opens Slack to post the throughput report. - Post a throughput report to the management channel with the day's key numbers
- Compare each metric to its recent average and mark whether it is up or down
- Call out the remake rate and the count of jobs past their promised date
Done when Managers have a Slack throughput report comparing the day to recent averages.
How is each run configured?
Secure by default
Connect once, stays signed in
WebRun signs in once and keeps each session in a persistent environment, so every run picks up right where it left off.
Every action is checked against this policy before it runs.
Questions, answered
Does this send anything to accounts or outside the lab?
No. WebRun only writes to your internal Google Sheet and posts to your internal management Slack channel. Nothing is sent to an account, so the nightly report runs safely on its own.
What metrics does the report cover?
Jobs started, finished, shipped, and remade for the day, average cycle time overall and by stage, jobs still open, and any past their promised date, each compared to recent averages.
Can I see trends over time, not just one day?
Yes. Each night's totals are appended to a Google Sheet with rolling weekly and monthly averages, so the trend in throughput and remake rate is visible across days and weeks.
Related templates
Put this on autopilot.
Turn it on in minutes - or have our team set it up for you.