Give each endoscopist a monthly adenoma detection rate scorecard
Each Monday, WebRun opens EndoManager, reads the month's screening colonoscopies and their pathology results, calculates adenoma detection rate, cecal intubation rate, and withdrawal time per endoscopist, builds a scorecard in Google Sheets, and posts a Microsoft Teams summary highlighting anyone below benchmark.
- No credit card
- Under $0.01 per run
- Cancel anytime
How do I automatically calculate adenoma detection rate per endoscopist?
WebRun scores endoscopist quality every month. It reads completed screening colonoscopies and their pathology outcomes in EndoManager, calculates each provider's adenoma detection rate, cecal intubation rate, and withdrawal time in Google Sheets, and posts a Microsoft Teams summary flagging anyone below benchmark, so the quality committee reviews clean numbers without pulling charts by hand.
- Every endoscopist gets a monthly ADR scorecard without manual chart review
- Providers below benchmark are flagged for the committee automatically
- Quality trends are visible month over month in one sheet
Built for endoscopy centers · GI quality committees · gastroenterology groups · ambulatory surgery centers
What does WebRun do on every run?
The exact actions WebRun takes, in order - in plain language, so you can adjust anything.
-
WebRun signs in and gets to work
Opens
newcura.comin a real browser with your saved login - no setup, no API keys. -
1
EndoManager - read colonoscopies and pathology outcomes
newcura.com How to Automate EndoManager

WebRun opens EndoManager to read colonoscopy outcomes. - Open EndoManager and pull screening colonoscopies completed in the reporting period
- For each case read the endoscopist, cecal intubation, withdrawal time, prep quality, and the linked pathology result
- Group cases by endoscopist and count how many had at least one adenoma on pathology
Done when Every screening colonoscopy is grouped by endoscopist with its pathology outcome.
-
2
Google Sheets - calculate ADR and withdrawal time
docs.google.com How to Automate Google Sheets
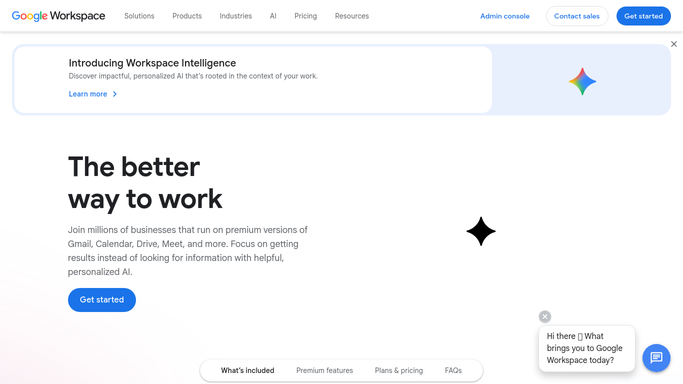
WebRun builds the ADR scorecard in Google Sheets. - Open the ADR Scorecard sheet
- Calculate each endoscopist's adenoma detection rate, cecal intubation rate, and average withdrawal time
- Compare each metric to the benchmark and highlight any endoscopist below target, using initials rather than patient identifiers
Done when The scorecard shows each endoscopist's metrics against benchmark for the period.
-
3
Microsoft Teams - share the scorecard with the committee
microsoft.com How to Automate Microsoft Teams
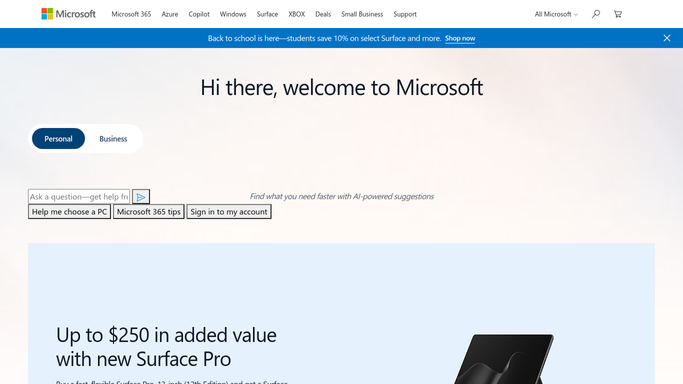
WebRun posts the scorecard summary to Teams. - Post a Teams summary to the quality committee channel with the group's overall ADR and cecal intubation rate
- Note which endoscopists are below the adenoma detection benchmark this period
- Link to the full Google Sheet and keep the summary internal to the committee
Done when The quality committee has a Teams summary of ADR performance against benchmark.
How is each run configured?
Secure by default
Connect once, stays signed in
WebRun signs in once and keeps each session in a persistent environment, so every run picks up right where it left off.
Every action is checked against this policy before it runs.
Questions, answered
Is patient information shared with the committee?
No. The scorecard reports rates per endoscopist using case counts and initials, not patient identifiers. The Teams summary is an internal quality digest, so no protected health information leaves your systems.
How is adenoma detection rate calculated?
It is the share of a provider's screening colonoscopies where pathology found at least one adenoma. WebRun links each case in EndoManager to its pathology result, counts the positives, and divides by that provider's eligible screening exams.
Can we compare against the benchmark we use?
Yes. You set the ADR, cecal intubation, and withdrawal-time targets, and WebRun highlights anyone below them each period so the committee can focus its review where it matters.
Related templates
Put this on autopilot.
Turn it on in minutes - or have our team set it up for you.