See your enrollment and revenue at the start of every month
On the first of every month, WebRun opens Teachworks and Stripe, pulls last month's enrollment counts, active student numbers, session volumes, and revenue collected, logs the figures to a Google Sheets dashboard, and posts a concise summary to the team Slack channel so everyone starts the month informed.
- No credit card
- Under $0.01 per run
- Cancel anytime
How do I automatically generate a monthly enrollment and revenue report for my tutoring center?
On the first of every month, WebRun pulls enrollment counts, session volumes, and revenue figures from Teachworks and Stripe, logs them to a Google Sheets dashboard, and posts a concise summary to the team Slack channel. The report gives every staff member the same picture of last month's performance before the new month gets busy.
- The whole team sees last month's enrollment and revenue figures on the first of every month without anyone compiling a report
- Trends are easy to spot because the Google Sheets dashboard accumulates month-on-month data automatically
- Directors spend Monday morning acting on the numbers rather than pulling them
Built for tutoring center directors · learning center owners · tutoring franchise operators · academic coaching businesses
What does WebRun do on every run?
The exact actions WebRun takes, in order - in plain language, so you can adjust anything.
-
WebRun signs in and gets to work
Opens
app.teachworks.comin a real browser with your saved login - no setup, no API keys. -
1
Teachworks - pull enrollment and session counts
teachworks.com How to Automate Teachworks
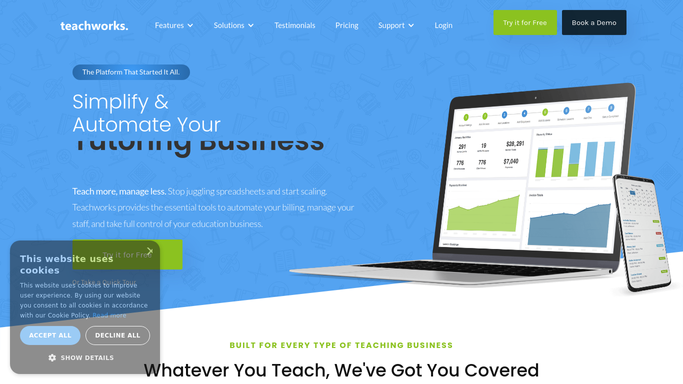
WebRun opens Teachworks to pull enrollment and session counts. - Open Teachworks and navigate to the reports or student overview section
- Capture total active students, new enrollments, cancellations, and sessions completed for the prior month
- Note the subject breakdown and any tutors with unusually high or low session counts
Done when All enrollment and session figures for the prior month are captured from Teachworks.
-
2
Stripe - pull monthly revenue collected
stripe.com How to Automate Stripe

WebRun opens Stripe to pull monthly revenue collected. - Open Stripe and navigate to the payments or reports section
- Capture total revenue collected, refunds issued, and any failed charges for the prior month
- Note any significant changes compared to the previous month
Done when All revenue and refund figures for the prior month are captured from Stripe.
-
3
Google Sheets - log figures to monthly dashboard
google.com How to Automate Google Sheets

WebRun opens Google Sheets to log figures to monthly dashboard. - Open the monthly enrollment and revenue dashboard in Google Sheets
- Add a new row for the prior month with all captured figures from Teachworks and Stripe
- Update any calculated columns such as revenue per student or session completion rate
Done when The dashboard has an up-to-date row for last month with all key metrics.
-
4
Slack - post summary to the team channel
slack.com How to Automate Slack

WebRun opens Slack to post summary to the team channel. - Post a concise monthly summary to the team or management Slack channel
- Include active students, new enrollments, churned students, sessions completed, and total revenue
- Add a link to the Google Sheets dashboard for the full breakdown
Done when The team has last month's key figures in Slack with a link to the full dashboard.
How is each run configured?
Secure by default
Connect once, stays signed in
WebRun signs in once and keeps each session in a persistent environment, so every run picks up right where it left off.
Every action is checked against this policy before it runs.
Questions, answered
Is the Slack summary sent automatically or does someone review it first?
The Slack summary is an internal staff report and posts automatically. It contains only aggregate figures with no individual student or payment data, so no approval step is required.
What figures does the report include?
It includes active student count, new enrollments, cancellations, sessions completed, total revenue collected, and refunds for the prior month, all drawn live from Teachworks and Stripe.
Can it compare this month to last month automatically?
Yes. The Google Sheets dashboard accumulates rows each month so month-on-month comparisons are always available. The Slack summary can include a delta versus the prior month if you configure it that way.
Related templates
Put this on autopilot.
Turn it on in minutes - or have our team set it up for you.