Score your SAP SuccessFactors headcount weekly
Every Monday, WebRun opens SAP SuccessFactors, pulls open requisitions, average time to fill, and net headcount change for the week, logs the numbers to Google Sheets, and updates a Notion dashboard so leadership sees the trend at a glance.
- No credit card
- Under $0.01 per run
- Cancel anytime
How do I build a weekly headcount scorecard from SAP SuccessFactors?
WebRun builds a weekly SAP SuccessFactors headcount scorecard every Monday. It pulls open requisitions, average time to fill, and net headcount change, logs the numbers to Google Sheets alongside prior weeks, and updates a Notion dashboard, so leadership sees hiring trends without logging into SuccessFactors themselves.
- Leadership sees the headcount trend every Monday without pulling a report
- Time to fill gets tracked automatically week over week
- Departments with stalled requisitions get flagged early
Built for HR leadership · talent acquisition leaders · People analytics · Chief People Officers
What does WebRun do on every run?
The exact actions WebRun takes, in order - in plain language, so you can adjust anything.
-
WebRun signs in and gets to work
Opens
successfactors.comin a real browser with your saved login - no setup, no API keys. -
1
SAP SuccessFactors - pull headcount and requisition data
successfactors.com
WebRun opens SAP SuccessFactors to pull headcount and requisition data. - Open SAP SuccessFactors and pull open requisitions by department
- Calculate average time to fill for roles closed this week
- Capture net headcount change since last week
Done when This week's requisition, time to fill, and headcount numbers are captured.
-
2
Google Sheets - log this week's numbers
google.com How to Automate Google Sheets

WebRun opens Google Sheets to log this week's numbers. - Add a new row with this week's numbers to the headcount tracker
- Keep prior weeks in the same sheet for trend lines
Done when This week's numbers are logged alongside prior weeks in Google Sheets.
-
3
Notion - update the leadership dashboard
notion.so How to Automate Notion
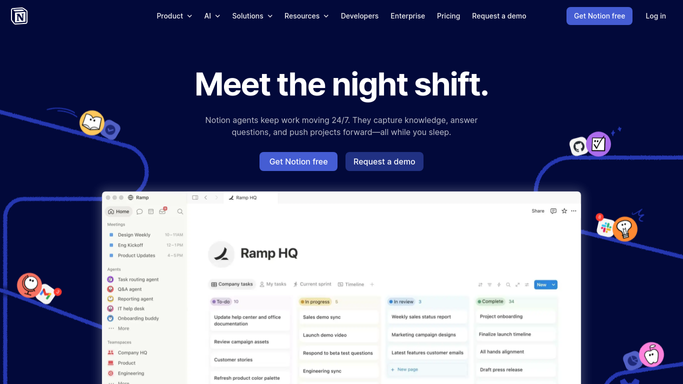
WebRun opens Notion to update the leadership dashboard. - Update the leadership dashboard page with the latest numbers and trend
- Highlight departments with requisitions open longer than target
Done when The Notion dashboard reflects this week's headcount scorecard.
How is each run configured?
Secure by default
Connect once, stays signed in
WebRun signs in once and keeps each session in a persistent environment, so every run picks up right where it left off.
Every action is checked against this policy before it runs.
Questions, answered
Does WebRun open or close requisitions?
No. It only reads requisition and headcount data. Opening, closing, or editing a requisition always stays a manual step inside SAP SuccessFactors.
How is time to fill calculated?
From the requisition's opened date to its filled date in SAP SuccessFactors, averaged across roles closed in the current week.
Can leadership see the trend over time?
Yes. Google Sheets keeps every week's row, and the Notion dashboard shows the trend so leadership isn't just seeing a single week in isolation.
Related templates
Put this on autopilot.
Turn it on in minutes - or have our team set it up for you.