See how your call queues really performed
Every Monday, WebRun opens Dialpad, reads last week's call queue and department numbers, stores answered, missed, and wait time by day in Airtable, and writes a Notion scorecard showing which queue kept callers waiting and on which days it happened.
- No credit card
- Under $0.01 per run
- Cancel anytime
How do I report on call queue performance in Dialpad each week?
WebRun reads last week's Dialpad call queue numbers every Monday, capturing answered calls, missed calls, and wait times by queue and by day. It stores the figures in Airtable and writes a Notion scorecard naming the department that kept callers waiting and the day it happened, so roster changes have a reason behind them.
- Monday starts with last week's answer rate per queue
- The worst day and hour band is named, not guessed
- Weekly figures accumulate in Airtable so trends are real, not anecdotal
Built for support managers · contact centre leads · operations teams · sales managers
What does WebRun do on every run?
The exact actions WebRun takes, in order - in plain language, so you can adjust anything.
-
WebRun signs in and gets to work
Opens
dialpad.com/appin a real browser with your saved login - no setup, no API keys. -
1
Dialpad - read last week's queue numbers
dialpad.com
WebRun opens Dialpad to read last week's queue numbers. - Open Dialpad and set the reporting range to last Monday through Sunday
- For each call queue and department, read total calls, answered, and missed
- Capture average and longest wait time, plus abandoned calls
- Break the figures down by day and by hour band so peaks are visible
Done when Every queue has last week's answered, missed, and wait figures by day.
-
2
Airtable - store the weekly figures
airtable.com How to Automate Airtable
WebRun opens Airtable to store the weekly figures. - Add a row per queue per day with calls, answered, missed, and wait times
- Tag each row with the department and the week ending date
- Keep prior weeks so the trend builds without rewriting history
- Flag any day where missed calls or wait time jumped against that queue's own average
Done when Last week's figures are stored in Airtable alongside earlier weeks.
-
3
Notion - write the queue scorecard
notion.so How to Automate Notion
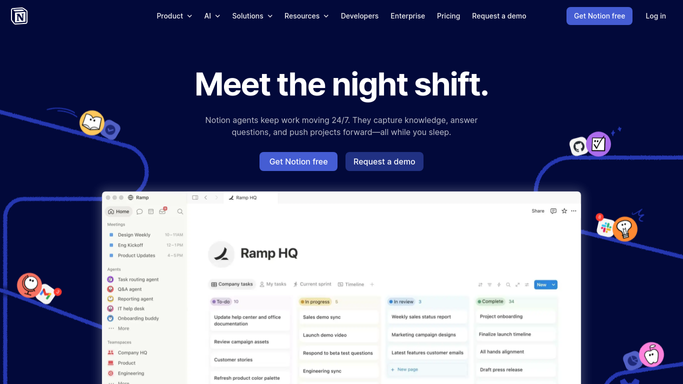
WebRun opens Notion to write the queue scorecard. - Write the weekly scorecard page with one table row per queue
- Show answer rate, average wait, longest wait, and missed calls against the week before
- Call out the worst day and hour band for the weakest queue
- Suggest where an extra agent would have made the difference, and leave roster changes to the manager
Done when The queue scorecard for last week is published in Notion.
How is each run configured?
Secure by default
Connect once, stays signed in
WebRun signs in once and keeps each session in a persistent environment, so every run picks up right where it left off.
Every action is checked against this policy before it runs.
Questions, answered
Does it change queue settings or rosters?
No. WebRun only reads reporting figures and writes them up. Adding agents, changing routing, or editing a queue stays with the manager who owns it.
Does it call or message customers?
No. This run never touches a call, a voicemail, or a contact. It reads aggregate queue numbers and writes an internal Airtable record and a Notion page.
How is a bad week actually spotted?
Every queue is compared against its own prior weeks, so a jump in missed calls or wait time is flagged with the day and hour band it happened in rather than an absolute target.
Related templates
Put this on autopilot.
Turn it on in minutes - or have our team set it up for you.