Rank your cookware brands by margin every week
Every Monday, WebRun opens RetailEdge, pulls the past week's sales by vendor and brand, checks each brand's cost of goods in QuickBooks, and logs a margin ranked report to Google Sheets so you know which brands are actually worth the shelf space.
- No credit card
- Under $0.01 per run
- Cancel anytime
What does WebRun do on every run?
The exact actions WebRun takes, in order - in plain language, so you can adjust anything.
-
WebRun signs in and gets to work
Opens
www.retailedge.comin a real browser with your saved login - no setup, no API keys. -
1
RetailEdge - pull sales by brand
retailedge.com How to Automate RetailEdge

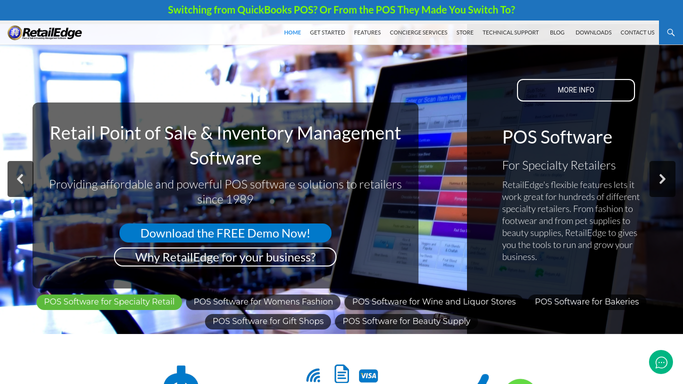
WebRun opens RetailEdge to pull sales by brand. - Open RetailEdge and pull the past week's sales grouped by vendor and brand
- Capture units sold and revenue for each brand
Done when Every brand sold this week has its units and revenue captured.
-
2
QuickBooks - check cost of goods by brand
- Open QuickBooks and pull the cost of goods sold for each brand
- Calculate gross margin percent per brand
Done when Every brand has a calculated margin percent.
-
3
Google Sheets - log the margin ranked report
google.com How to Automate Google Sheets
WebRun opens Google Sheets to log the margin ranked report. - Open the brand margin report and add this week's ranked rows
- Sort brands from highest to lowest margin percent
- Highlight any brand whose margin dropped from last week
Done when This week's brand margin report is logged and ranked in Google Sheets.

How do I find out which cookware brands have the best margins?
Every Monday, WebRun pulls the past week's sales by vendor and brand from RetailEdge, checks each brand's cost of goods in QuickBooks, and logs a margin ranked report to Google Sheets. You see which cookware brands earn their shelf space and which ones quietly drag down your margin, without building the report by hand yourself.
- Brand margins get ranked automatically every week
- Low margin brands surface before they eat into shelf space
- No manual pull from RetailEdge or QuickBooks needed
Built for cookware and kitchenware retailers · independent housewares store buyers · specialty kitchen shop owners
How is each run configured?
Secure by default
Connect once, stays signed in
WebRun signs in once and keeps each session in a persistent environment, so every run picks up right where it left off.
Every action is checked against this policy before it runs.
Questions, answered
Does this change any prices or orders?
No. It only reads sales and cost data to build a report. It never changes a price, a purchase order, or anything in RetailEdge or QuickBooks.
How is margin calculated?
It takes each brand's weekly revenue from RetailEdge and subtracts the cost of goods sold from QuickBooks, giving a gross margin percent per brand.
What if a brand had no sales that week?
It's left off that week's ranking rather than shown with a misleading zero margin, so the report only ranks brands that actually sold.
Related templates
Put this on autopilot.
Turn it on in minutes - or have our team set it up for you.