Get a weekly CDN77 performance scorecard
Every Monday morning, WebRun opens the CDN77 dashboard, reads the past week's bandwidth delivered, cache hit ratio, and origin pull volume for each CDN resource, emails the team a scorecard through Gmail, and logs the same figures as a new row in Airtable so performance trends stay visible.
- No credit card
- Under $0.01 per run
- Cancel anytime
How do I track CDN77 performance and cache efficiency every week?
Every Monday, WebRun reads the past week's bandwidth delivered, cache hit ratio, and origin pull volume for every CDN77 resource. It emails the team a scorecard through Gmail, flagging any resource with a falling cache hit ratio, and logs the same figures to Airtable, so CDN performance stays visible without a manual pull.
- A falling cache hit ratio gets flagged before it shows up as a slow site
- The whole team sees performance in one email, every Monday
- A running Airtable log makes month over month comparisons easy
Built for web performance teams · streaming and media companies · DevOps engineers · CDN77 customers
What does WebRun do on every run?
The exact actions WebRun takes, in order - in plain language, so you can adjust anything.
-
WebRun signs in and gets to work
Opens
www.cdn77.comin a real browser with your saved login - no setup, no API keys. -
1
CDN77 - read bandwidth, cache, and origin pull volume
cdn77.com
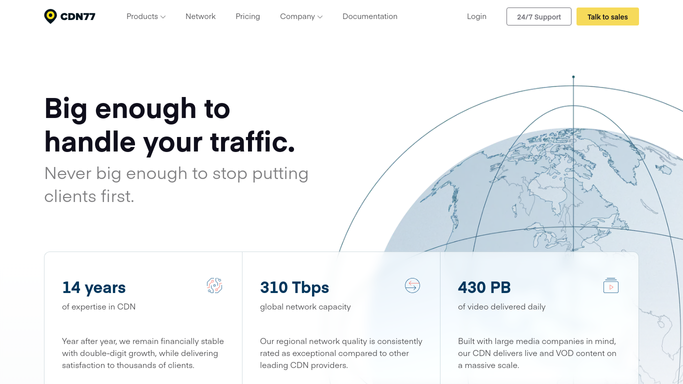
WebRun opens CDN77 to read bandwidth, cache, and origin pull volume. - Open the CDN77 dashboard and go through each CDN resource
- Capture bandwidth delivered, cache hit ratio, and origin pull volume for the past 7 days
- Note any resource with a falling cache hit ratio or rising origin pulls
Done when Every resource's bandwidth, cache, and origin pull figures are captured for the week.
-
2
Gmail - email the weekly scorecard
gmail.com How to Automate Gmail

WebRun opens Gmail to email the weekly scorecard. - Draft and send a weekly scorecard email through Gmail
- List each resource with this week's bandwidth, cache hit ratio, and origin pull volume
- Call out any resource whose cache hit ratio is trending down
Done when The team has this week's CDN77 scorecard in their inbox.
-
3
Airtable - log the figures for trend tracking
airtable.com How to Automate Airtable
WebRun opens Airtable to log the figures for trend tracking. - Open the CDN performance base in Airtable
- Add a new row per resource with this week's figures
- Keep prior weeks in place so the trend is visible over time
Done when This week's figures are logged in Airtable alongside prior weeks.
How is each run configured?
Secure by default
Connect once, stays signed in
WebRun signs in once and keeps each session in a persistent environment, so every run picks up right where it left off.
Every action is checked against this policy before it runs.
Questions, answered
Does it purge cache or change any CDN77 settings?
No. WebRun only reads delivery metrics and reports them. Purging cache or changing a resource's configuration always stays your decision.
What does a rising origin pull volume usually mean?
It often means content is being cached less effectively, which is exactly why WebRun calls it out in the scorecard rather than leaving it buried in a dashboard.
Can I track more than one CDN resource?
Yes. Every CDN resource on your account gets its own line in the scorecard and its own row in Airtable each week.
Related templates
Put this on autopilot.
Turn it on in minutes - or have our team set it up for you.