Catch Back4app API errors and request spikes early
Every hour, WebRun opens the Back4app dashboard, reads API request volume and error rate for each app, archives the detailed request log as a file in Google Drive, and posts a Slack alert naming the app and the error rate whenever it climbs meaningfully above the app's normal baseline.
- No credit card
- Under $0.01 per run
- Cancel anytime
How do I get alerted when my Back4app API error rate spikes?
Every hour, WebRun checks each Back4app app's API request volume and error rate, archives the detailed request log to Google Drive, and posts a Slack alert naming the app, the error rate, and the endpoint generating the most errors whenever it spikes above that app's normal baseline, so a backend problem gets caught fast.
- An error spike gets caught within the hour, not from a user complaint
- Every alert names the endpoint driving the errors, not just a percentage
- Request logs are archived hourly for a searchable troubleshooting history
Built for mobile app developers · backend engineers · Back4app customers · small development teams
What does WebRun do on every run?
The exact actions WebRun takes, in order - in plain language, so you can adjust anything.
-
WebRun signs in and gets to work
Opens
www.back4app.comin a real browser with your saved login - no setup, no API keys. -
1
Back4app - check API request volume and error rate
back4app.com
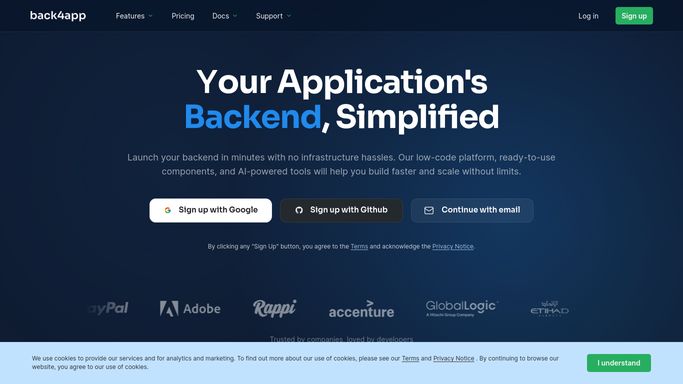
WebRun opens Back4app to check API request volume and error rate. - Open the Back4app dashboard and check API request volume and error rate for each app
- Compare the current error rate against that app's normal baseline
- Capture which endpoint or class is generating the most errors
Done when Request volume and error rate are captured for every app this run.
-
2
Google Drive - archive the request log
drive.google.com How to Automate Google Drive
WebRun opens Google Drive to archive the request log. - Save the detailed request and error log for each app as a file in the Back4app folder in Google Drive
- Name the file with the app and the date
- Keep a running archive rather than overwriting the prior log
Done when This run's request logs are archived in Google Drive.
-
3
Slack - alert Slack on an error spike
slack.com How to Automate Slack

WebRun opens Slack to alert Slack on an error spike. - Post a Slack alert naming any app whose error rate has spiked above its baseline
- Include the error rate and the endpoint or class generating the most errors
- Stay quiet when every app's error rate is within its normal range
Done when Slack has an alert for every app with a genuine error spike this run.
How is each run configured?
Secure by default
Connect once, stays signed in
WebRun signs in once and keeps each session in a persistent environment, so every run picks up right where it left off.
Every action is checked against this policy before it runs.
Questions, answered
Does it roll back code or change app settings?
No. WebRun only reads request and error metrics and reports them. Rolling back a Cloud Code deployment or changing a setting stays a decision your team makes.
How is a normal baseline set?
WebRun learns each app's typical error rate from its recent history, so the alert reflects a real spike rather than a fixed number that does not fit every app.
Can I see what is actually causing the errors?
The Slack alert names the endpoint or class generating the most errors, and the full request log archived in Google Drive has the detail behind it.
Related templates
Put this on autopilot.
Turn it on in minutes - or have our team set it up for you.