Catch slow database queries before they hurt users
Every hour, WebRun opens the Prisma Data Platform, checks query insights for queries running slower than your threshold or failing outright, texts the backend lead through Twilio naming the query and its response time, and saves the full query details to a Google Drive folder so an engineer has enough context to start optimizing right away.
- No credit card
- Under $0.01 per run
- Cancel anytime
How do I get alerted about slow database queries in Prisma?
WebRun checks Prisma's query insights every hour for queries running slower than your threshold or failing outright. It texts the backend lead through Twilio with the query and response time, and saves the full details to Google Drive, so slow database performance gets caught and optimized before it hurts real users.
- Slow queries get a text within the hour they're detected
- Every flagged query's full context is saved for faster optimization
- Database performance problems get caught before they hurt users
Built for backend engineering teams · database administrators · platform teams · DevOps
What does WebRun do on every run?
The exact actions WebRun takes, in order - in plain language, so you can adjust anything.
-
WebRun signs in and gets to work
Opens
cloud.prisma.ioin a real browser with your saved login - no setup, no API keys. -
1
Prisma Data Platform - check query insights for slow or failing queries
prisma.io
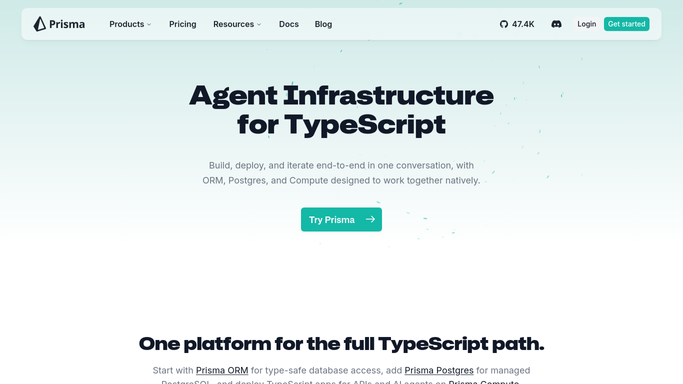
WebRun opens Prisma Data Platform to check query insights for slow or failing queries. - Open the Prisma Data Platform and check query insights for the past hour
- Capture any query running slower than your set threshold or failing outright
- Note the affected application and how often the query ran
Done when Every query above the slow threshold or failing this hour is listed with its details.
-
2
Twilio - text the backend lead
twilio.com How to Automate Twilio

WebRun opens Twilio to text the backend lead. - Text the backend lead the query and its response time for each flagged query
- Keep the message to the essential detail needed to start investigating
- Send one message per newly flagged query, not a batch
Done when The backend lead has a text for every newly flagged query.
-
3
Google Drive - save the query details
drive.google.com How to Automate Google Drive
WebRun opens Google Drive to save the query details. - Save the full query details and timing to the performance folder
- Name the file with the application and the time it was captured
- Keep a running folder so performance history is easy to review
Done when Every newly flagged query has its details saved to Drive.
How is each run configured?
Secure by default
Connect once, stays signed in
WebRun signs in once and keeps each session in a persistent environment, so every run picks up right where it left off.
Every action is checked against this policy before it runs.
Questions, answered
Will it optimize the query or change the schema?
No. WebRun only reports what it finds. Optimizing a query or changing the schema is always done by an engineer.
What counts as slow?
You set the response time threshold. Anything running slower than that, or failing outright, gets flagged.
Where can I find the full query details later?
In the Drive folder. Every flagged query's details are saved there for as long as you need them.
Related templates
Put this on autopilot.
Turn it on in minutes - or have our team set it up for you.