Catch API traffic anomalies in Apigee every morning
Every morning, WebRun opens Apigee, reviews traffic, error rate, and latency for each API proxy over the last 24 hours, exports the numbers to a Google Sheet, and posts a Notion summary flagging any proxy running outside its normal range.
- No credit card
- Under $0.01 per run
- Cancel anytime
How do I catch Apigee API traffic anomalies before customers notice?
WebRun reviews Apigee traffic every morning for each API proxy, comparing the last 24 hours of error rate and latency against its 30 day average, and exports the full numbers to a Google Sheet. It then posts a Notion summary naming any proxy running outside its normal range, so traffic problems surface before a customer reports them.
- Traffic problems surface every morning instead of waiting for a customer report
- Error rate and latency are tracked against each proxy's own normal range
- The full history lives in a sheet without anyone exporting it by hand
Built for API platform teams · backend engineering teams · site reliability engineers · integration teams
What does WebRun do on every run?
The exact actions WebRun takes, in order - in plain language, so you can adjust anything.
-
WebRun signs in and gets to work
Opens
apigee.google.comin a real browser with your saved login - no setup, no API keys. -
1
Apigee - review proxy traffic
apigee.com
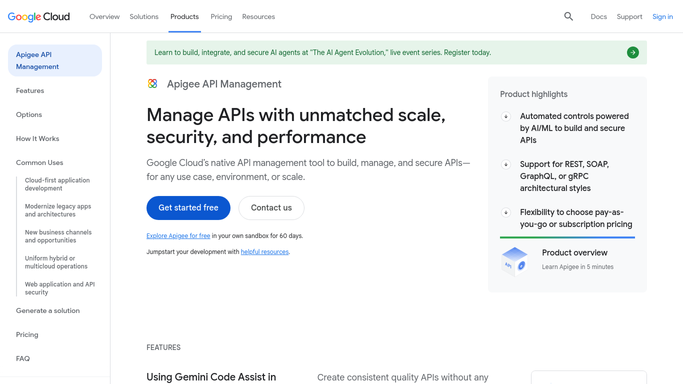
WebRun opens Apigee to review proxy traffic. - Open Apigee analytics and review traffic, error rate, and average latency per API proxy for the last 24 hours
- Compare each proxy's error rate and latency against its 30 day average
- Flag any proxy running well outside its normal range
Done when Every proxy's traffic, error rate, and latency are recorded against its normal range.
-
2
Notion - export traffic metrics
notion.so How to Automate Notion

WebRun opens Notion to post the anomaly summary. - Open the API platform Notion page
- Post a daily summary naming any proxy with an unusual error rate or latency
- Link to the full Google Sheet export
Done when The API team has today's anomaly summary in Notion.
-
3
Google Sheets - post the anomaly summary
google.com How to Automate Google Sheets

WebRun opens Google Sheets to export traffic metrics. - Open the Apigee Traffic Log sheet
- Add a row per proxy with yesterday's traffic count, error rate, and average latency
- Highlight rows flagged as outside normal range
Done when The sheet holds yesterday's full traffic export with anomalies highlighted.
How is each run configured?
Secure by default
Connect once, stays signed in
WebRun signs in once and keeps each session in a persistent environment, so every run picks up right where it left off.
Every action is checked against this policy before it runs.
Questions, answered
Will WebRun throttle or change a proxy's configuration?
No. It only reads analytics and reports on them. Changing rate limits, policies, or proxy configuration stays a manual action in Apigee.
What counts as an anomaly?
A proxy whose error rate or average latency over the last 24 hours falls well outside its own 30 day average, so normal daily traffic swings do not trigger false flags.
Can it cover multiple environments?
Yes. Point it at the environments you want watched, such as test and prod, and it reports on each separately.
Related templates
Put this on autopilot.
Turn it on in minutes - or have our team set it up for you.