Send a weekly error-rate report to your engineering team
Every Monday, WebRun opens Sentry and Datadog, reads last week's error counts by service, computes week-over-week change, and posts a ranked report to Slack so the team can see which services improved and which got worse.
- No credit card
- Under $0.01 per run
- Cancel anytime
What does WebRun do on every run?
The exact actions WebRun takes, in order - in plain language, so you can adjust anything.
-
WebRun signs in and gets to work
Opens
sentry.ioin a real browser with your saved login - no setup, no API keys. -
1
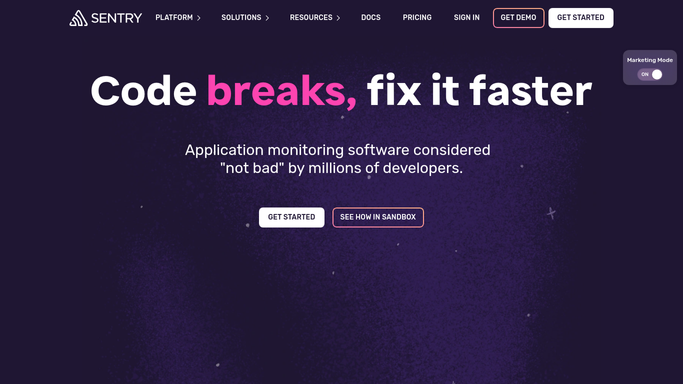
Sentry - read last week's error counts by service
sentry.io How to Automate Sentry

WebRun opens Sentry to read last week's error counts by service. - Open Sentry Stats and filter to the past 7 days
- Read total event count, unique issues, and top-5 issues by volume for each project
- Note any new issues that didn't exist the previous week
Done when Error counts and top issues for all Sentry projects are captured.
-
2
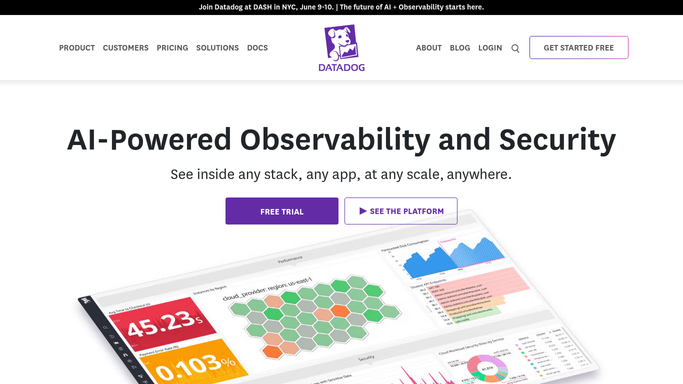
Datadog - cross-reference error-rate metrics
datadoghq.com How to Automate Datadog
WebRun opens Datadog to cross-reference error-rate metrics. - Open Datadog Metrics Explorer and query error-rate for each service over the past 7 days
- Compare the average error rate this week to last week (percentage change)
- Flag services whose error rate increased more than 20% week-over-week
Done when Week-over-week error-rate change is calculated for every service.
-
3
Slack - post the weekly trend report
slack.com How to Automate Slack
WebRun opens Slack to post the weekly trend report. - Post the report to #engineering: services ranked by error count, with WoW percentage change
- Put biggest regressions at the top in bold; put biggest improvements at the bottom
Done when The team has this week's error-rate trend report in Slack.

How can I automatically send a weekly error-rate report to my engineering team?
Every Monday, WebRun opens Sentry and Datadog, reads last week's error counts by service, computes week-over-week change, and posts a ranked report to Slack - so your engineering team can see at a glance which services improved and which got worse, without pulling the data manually.
- Error trends visible week-over-week without manual data pulling
- Services ranked by change so regressions are immediately obvious
- Team aligned on quality direction before the week begins
Built for engineering managers · SRE teams · DevOps engineers · engineering teams
How is each run configured?
Secure by default
Connect once, stays signed in
WebRun signs in once and keeps each session in a persistent environment, so every run picks up right where it left off.
Every action is checked against this policy before it runs.
Questions, answered
Does it create tickets for regressions automatically?
No - it highlights them for you. Opening tickets is a human decision so context and priority can be applied properly.
Which services does it cover?
Whichever Sentry projects and Datadog services you list in the plan - add as many as you like.
Can it send the report by email instead of Slack?
Yes. Swap the delivery channel in the plan and WebRun will email the report to whoever you specify.
Related templates
Put this on autopilot.
Turn it on in minutes - or have our team set it up for you.