Automated Honeycomb Telemetry Gap Checks
Every hour, WebRun opens Honeycomb, goes through each dataset in every environment to see when it last received an event, logs the quiet ones to Airtable with how long the silence has lasted, and writes an on-call note in Notion naming the services that stopped sending telemetry.
How do I know when a service stops sending telemetry?
WebRun watches for telemetry gaps in Honeycomb every hour. It checks when each dataset in every environment last received events and how the hour's volume compares to normal, logs silent and thin datasets to Airtable with the duration of the gap, and writes an on-call note in Notion naming what went quiet.
- A service that went quiet is known within the hour
- A broken exporter is not mistaken for a service with no errors
- Every gap gets a start time, an end time and a duration on record
Built for on-call engineers · site reliability engineers · platform teams · observability owners
What does WebRun do on every run?
The exact actions WebRun takes, in order - in plain language, so you can adjust anything.
-
WebRun signs in and gets to work
Opens
ui.honeycomb.io/loginin a real browser with your saved login - no setup, no API keys. -
1
Honeycomb - check when each dataset last received events
honeycomb.io
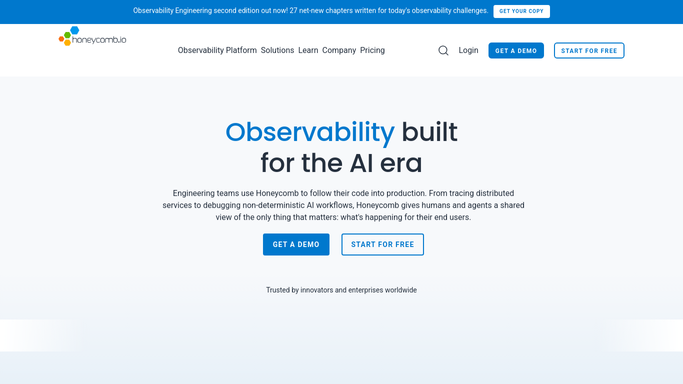
WebRun opens Honeycomb to check when each dataset last received events. - Sign into Honeycomb and list the datasets in each environment you monitor
- For each dataset check when the most recent events arrived and roughly how many came in over the last hour
- Compare that against the volume the dataset normally sees at this time of day
- Mark datasets that received nothing at all, and separately those whose volume collapsed but did not stop
- Note whether any expected columns have stopped appearing, which can mean a partial instrumentation break
- Check whether any trigger on those datasets is in a state that would never fire while events are absent
Done when Every dataset has a last event time and a mark for silent, thin or normal.
-
2
Airtable - log the quiet datasets
airtable.com
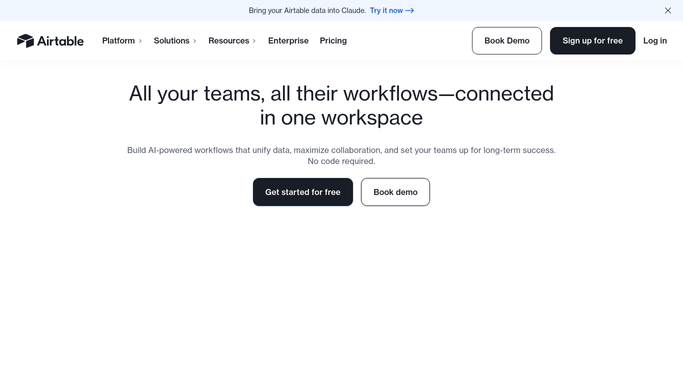
WebRun opens Airtable to log the quiet datasets. - Append this hour's check to your telemetry health table, one row per dataset
- Record the environment, the last event time, the hour's event volume and the silent, thin or normal mark
- Keep an open record per gap so you can see when the silence started and when it ended
- Close the record automatically once events resume, keeping the duration
Done when Airtable holds this hour's per dataset state and an open record for every ongoing gap.
-
3
Notion - write the on-call note
notion.so
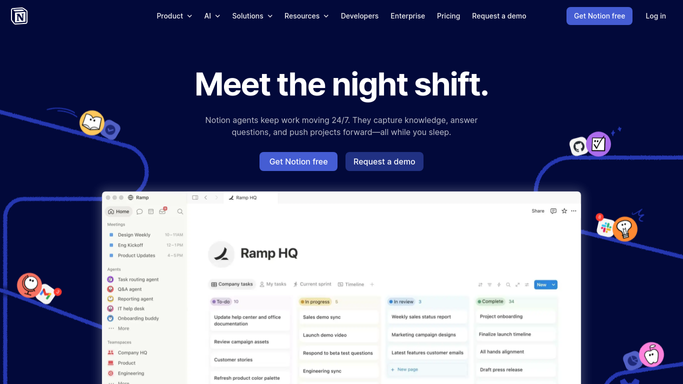
WebRun opens Notion to write the on-call note. - Write the on-call note into your engineering Notion page
- Name every dataset that has received no events and how long it has been silent
- Add the datasets whose volume dropped sharply without stopping
- Say plainly that silence is not health, so a quiet dataset is a suspect exporter rather than a service with no errors
- Say nothing new when every dataset is receiving events normally
Done when The on-call note names every silent or thin dataset, or confirms all are healthy.
How is each run configured?
Secure by default
Connect once, stays signed in
WebRun signs in once and keeps each session in a persistent environment, so every run picks up right where it left off.
Every action is checked against this policy before it runs.
Questions, answered
Will it change my Honeycomb triggers or datasets?
No. WebRun only reads dataset activity, event volume and column presence. It never creates, edits or silences a trigger, and never deletes a dataset, so your Honeycomb configuration is exactly as your team left it.
Why does a healthy SLO not catch this?
An SLO computed over events cannot fail when there are no events. A broken exporter looks identical to a service with no errors, so this check watches for silence itself and reports a dataset that has stopped receiving anything.
How quiet is quiet enough to flag?
You set the threshold per dataset, since a busy API and a nightly batch job have very different normals. WebRun compares the hour's volume against what that dataset usually sees at that time of day and marks it silent or thin.
Related templates
Put this on autopilot.
Turn it on in minutes - or have our team set it up for you.