See which equipment earns its keep and which sits idle
Every Monday, WebRun opens Point of Rental, reads each asset's rental days and idle days for the past 30 days, pulls the revenue each asset generated from QuickBooks, calculates a utilization rate per asset, and posts your ops team a Slack report ranking equipment from best to worst performing.
- No credit card
- Under $0.01 per run
- Cancel anytime
What does WebRun do on every run?
The exact actions WebRun takes, in order - in plain language, so you can adjust anything.
-
WebRun signs in and gets to work
Opens
www.point-of-rental.comin a real browser with your saved login - no setup, no API keys. -
1
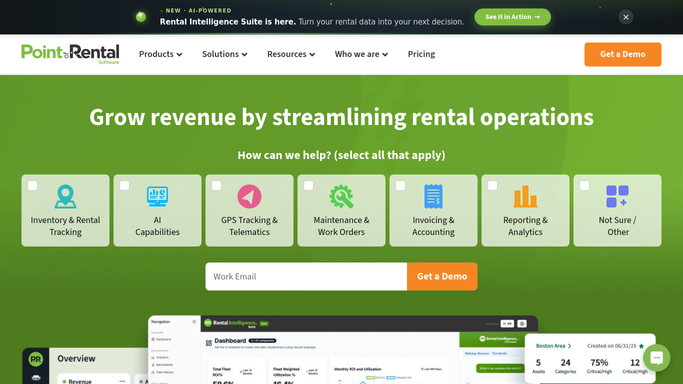
Point of Rental - read rental days per asset
point-of-rental.com How to Automate Point of Rental

WebRun opens Point of Rental to read rental days per asset. - Open Point of Rental and pull each asset's rental days and idle days for the trailing 30 days
- Group assets by category, such as aerial lifts, compaction, or earthmoving
- Calculate a utilization rate for each asset as rental days divided by available days
Done when Every active asset has a utilization rate for the trailing 30 days.
-
2
QuickBooks - pull revenue per asset
- Open QuickBooks and pull the rental revenue posted against each asset for the same period
- Match revenue to the asset ID or category from Point of Rental
- Flag any asset with revenue but no matching utilization data, or the reverse
Done when Every asset's utilization rate is paired with its revenue for the period.
-
3
Slack - post the utilization report
slack.com How to Automate Slack
WebRun opens Slack to post the utilization report. - Post a utilization report to the ops channel ranking equipment from highest to lowest utilization
- Call out the bottom five assets by category as candidates for redeployment or sale
- Include the total fleet utilization rate for the period
Done when Ops has this week's ranked utilization report in Slack.

How do I track which rental equipment is underutilized?
WebRun reads every asset's rental days and idle days in Point of Rental each Monday, then pulls the matching revenue from QuickBooks to calculate a utilization rate per asset. It posts your ops team a Slack report ranking equipment from best to worst performing, so underused equipment gets noticed by category before it becomes dead capital.
- Underused equipment surfaces every Monday instead of at year end
- Utilization is paired with real revenue, not just booking counts
- The bottom performing assets are ranked and ready for a fleet decision
Built for construction equipment rental yards · heavy equipment fleet managers · rental operations managers · equipment rental owners
How is each run configured?
Secure by default
Connect once, stays signed in
WebRun signs in once and keeps each session in a persistent environment, so every run picks up right where it left off.
Every action is checked against this policy before it runs.
Questions, answered
Is it safe to run unattended?
Yes. This report only reads asset activity in Point of Rental and revenue in QuickBooks, then posts an internal Slack summary. It changes no records and contacts no customer, so it is safe to run every week.
How is utilization calculated?
It divides each asset's rental days by its available days over the trailing 30 days, then pairs that rate with the revenue QuickBooks recorded for the same asset over the same period.
What should I do with the lowest performing assets?
WebRun flags them in the report. Deciding whether to redeploy, discount, or sell an underused asset stays a decision for your fleet manager, WebRun only surfaces the candidates.
Related templates
Put this on autopilot.
Turn it on in minutes - or have our team set it up for you.