Get your Databox KPI scorecard every week
Every Monday, WebRun opens Databox, reads the current value of every KPI on your tracked scorecards, writes a short summary doc in Notion with what moved most, and exports the raw numbers into Google Sheets for anyone who wants to dig deeper.
- No credit card
- Under $0.01 per run
- Cancel anytime
How do I get a weekly summary of my Databox KPI scorecards?
WebRun reads every KPI on your tracked Databox scorecards each Monday, writes a short summary of what moved most in Notion, and exports the raw numbers into Google Sheets. Business and marketing teams get a readable weekly summary plus the raw data to dig deeper, without opening Databox themselves.
- A readable weekly summary lands in Notion without opening Databox
- The raw numbers are always available for a deeper look
- A broken data source is flagged, not silently missing
Built for business owners · marketing teams · operations teams
What does WebRun do on every run?
The exact actions WebRun takes, in order - in plain language, so you can adjust anything.
-
WebRun signs in and gets to work
Opens
app.databox.comin a real browser with your saved login - no setup, no API keys. -
1
Databox - read the tracked KPIs
databox.com
WebRun opens Databox to read the tracked KPIs. - Open the tracked scorecards in Databox
- Read the current value of every KPI
- Note which ones moved most since last week
Done when This week's KPI values are read and compared.
-
2
Notion - write the summary doc
notion.so How to Automate Notion
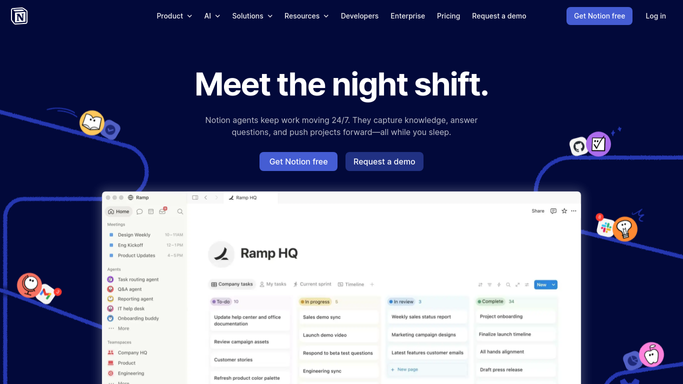
WebRun opens Notion to write the summary doc. - Open the KPI summary page in Notion
- Write a short summary of what moved most and by how much
- Link back to the Databox scorecard for full detail
Done when This week's summary is published in Notion.
-
3
Google Sheets - export the raw numbers
google.com How to Automate Google Sheets

WebRun opens Google Sheets to export the raw numbers. - Open the shared export sheet in Google Sheets
- Add this week's KPI values as a new row
- Keep column headers consistent with the scorecard's KPI names
Done when This week's numbers are a new row in the export sheet.
How is each run configured?
Secure by default
Connect once, stays signed in
WebRun signs in once and keeps each session in a persistent environment, so every run picks up right where it left off.
Every action is checked against this policy before it runs.
Questions, answered
Does WebRun change any KPI definition in Databox?
No. It only reads the current values shown. Editing a KPI, a data source, or the scorecard itself stays a human task.
Why both a Notion doc and a Sheets export?
The Notion doc is the readable summary of what moved. The Sheets export is the raw numbers for anyone who wants to build their own chart or pivot.
What if a KPI's underlying data source is disconnected?
It's reported as unavailable rather than skipped silently, so a broken connection doesn't just disappear from the summary.
Related templates
Put this on autopilot.
Turn it on in minutes - or have our team set it up for you.