Export your code maintainability trend every week
Every Friday, WebRun opens Code Climate, pulls the current maintainability grade, test coverage, and issue count for every monitored repository, exports the numbers as a new row in a Google Sheet so the trend builds over time, and emails engineering leads a short summary naming any repository whose grade slipped.
- No credit card
- Under $0.01 per run
- Cancel anytime
How do I track code maintainability trends across my repositories?
WebRun pulls each repository's Code Climate maintainability grade, coverage, and issue count every Friday, exporting the numbers to a Google Sheet so the trend builds over time. It emails engineering leads a short summary naming any repository whose grade slipped, so technical debt gets tracked weekly instead of discovered during a big refactor.
- Maintainability trends are tracked weekly instead of only at refactor time
- A slipping grade gets named in the summary before it gets worse
- Engineering leads see the trend without opening every repository
Built for engineering managers · tech leads · platform teams · software engineering teams
What does WebRun do on every run?
The exact actions WebRun takes, in order - in plain language, so you can adjust anything.
-
WebRun signs in and gets to work
Opens
codeclimate.com/loginin a real browser with your saved login - no setup, no API keys. -
1
Code Climate - pull the week's maintainability data
codeclimate.com
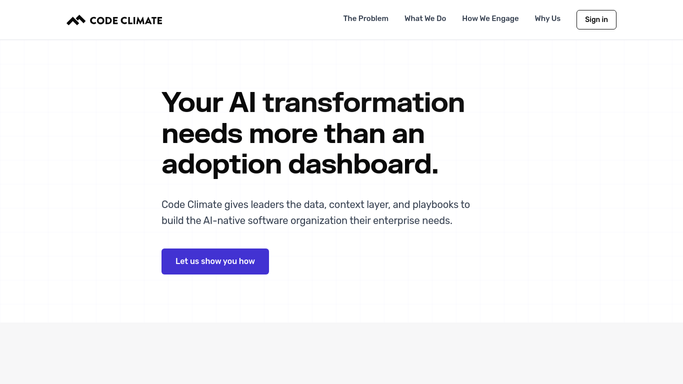
WebRun opens Code Climate to pull the week's maintainability data. - Open Code Climate and check the current maintainability grade for every monitored repository
- Record the test coverage percentage and open issue count
- Compare this week's grade against last week's
Done when Every monitored repository has this week's grade, coverage, and issue count.
-
2
Google Sheets - export it to a sheet
google.com How to Automate Google Sheets

WebRun opens Google Sheets to export it to a sheet. - Add this week's grade, coverage, and issues as a new row per repository
- Flag any repository whose grade slipped from last week
- Keep prior weeks in place so the trend is visible
Done when This week's numbers are logged as a new row for every repository.
-
3
Gmail - email engineering leads
gmail.com How to Automate Gmail
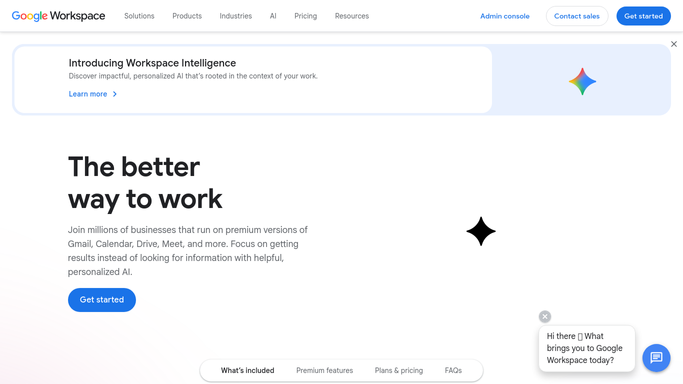
WebRun opens Gmail to email engineering leads. - Draft a short internal summary email to engineering leads
- Name any repository whose grade slipped this week
- Send it to the internal engineering leads list
Done when Engineering leads have this week's maintainability summary email.
How is each run configured?
Secure by default
Connect once, stays signed in
WebRun signs in once and keeps each session in a persistent environment, so every run picks up right where it left off.
Every action is checked against this policy before it runs.
Questions, answered
Will it fix any flagged issues?
No. WebRun only reads the grade and issue counts Code Climate already calculates. Fixing an issue is always done by an engineer.
Who gets the summary email?
Your internal engineering leads distribution list. It's an internal report and never leaves your team.
Can I track a repository's trend over months?
Yes. Every week's numbers are added as a new row in the same sheet, so long term trends build up automatically.
Related templates
Put this on autopilot.
Turn it on in minutes - or have our team set it up for you.