Export your CircleCI build health every day
Every evening, WebRun opens CircleCI, pulls the day's pipeline runs across every project, exports the pass and fail counts with the most common failure reasons to a Google Sheet, and emails the engineering team when the day's failure rate is well above the recent average.
- No credit card
- Under $0.01 per run
- Cancel anytime
How do I track CircleCI build health without checking the dashboard daily?
WebRun pulls your CircleCI pipeline results every evening, exporting the day's pass rate, run count, and top failure reasons to a Google Sheet with a rolling average for comparison. It emails the team only when a day's failure rate spikes well above normal, so build health stays visible without a daily inbox alert.
- Build health is logged daily without anyone checking the dashboard
- Failure spikes get an email while routine days stay quiet
- Failure reasons are tracked so patterns become visible over time
Built for DevOps teams · engineering managers · platform teams · release engineers
What does WebRun do on every run?
The exact actions WebRun takes, in order - in plain language, so you can adjust anything.
-
WebRun signs in and gets to work
Opens
app.circleci.comin a real browser with your saved login - no setup, no API keys. -
1
CircleCI - pull the day's pipeline results
circleci.com
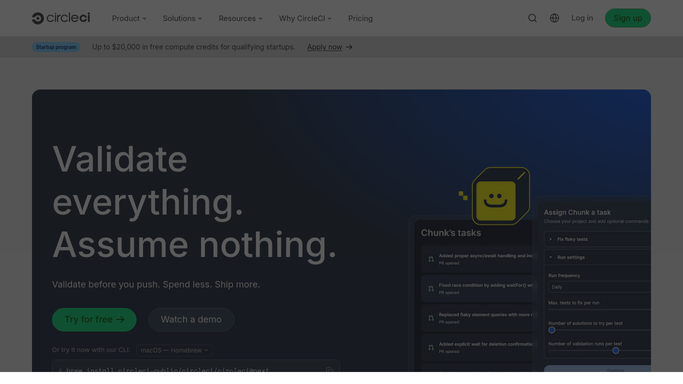
WebRun opens CircleCI to pull the day's pipeline results. - Open CircleCI Insights and pull today's pipeline runs across all projects
- Total the pass and fail counts and the average run duration
- Group failures by their most common cause
Done when Today's pipeline runs are totaled with pass, fail, and top failure reasons.
-
2
Google Sheets - export build health to a sheet
google.com How to Automate Google Sheets

WebRun opens Google Sheets to export build health to a sheet. - Add today's totals as a new row in the build health sheet
- Record the pass rate, run count, and top failure reasons
- Calculate the rolling 7 day average failure rate for comparison
Done when Today's row is logged in the sheet with the rolling average updated.
-
3
Gmail - email a summary when failures spike
gmail.com How to Automate Gmail
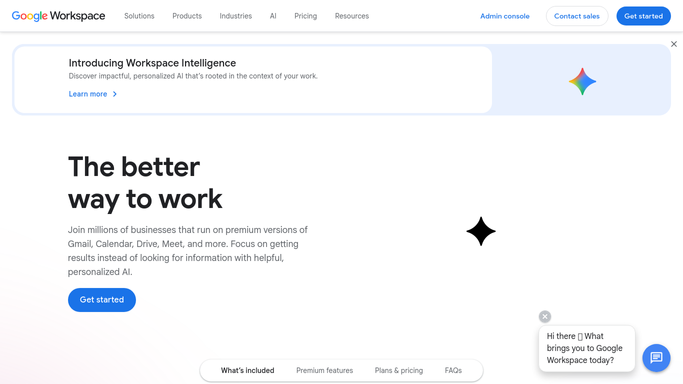
WebRun opens Gmail to email a summary when failures spike. - Draft a short internal email only when today's failure rate is well above the rolling average
- Name the projects and failure reasons driving the spike
- Skip the email entirely on a normal day
Done when The team has an email only on days where the failure rate spiked.
How is each run configured?
Secure by default
Connect once, stays signed in
WebRun signs in once and keeps each session in a persistent environment, so every run picks up right where it left off.
Every action is checked against this policy before it runs.
Questions, answered
Will it retry failed builds or change pipeline config?
No. WebRun only reads pipeline results. Retrying a build or editing configuration is left to your engineers.
Do I get an email every day?
No. The sheet is updated daily, but the email only goes out when the day's failure rate is well above the rolling average, so routine days stay quiet.
Can I see which projects fail most often?
Yes. Every row records the top failure reasons and which projects drove them, so patterns show up in the sheet over time.
Related templates
Put this on autopilot.
Turn it on in minutes - or have our team set it up for you.