See how efficiently each allergy provider is using their schedule
Every Monday, WebRun opens Practice Fusion and reads the prior week's appointment data for each allergy provider, calculating booked utilization rate, no-show and cancellation rate, and appointment type mix (new patients versus returning, shots versus consults). It logs results to Google Sheets and posts a provider scorecard to Slack so management can spot scheduling inefficiencies and balance capacity.
- No credit card
- Under $0.01 per run
- Cancel anytime
What does WebRun do on every run?
The exact actions WebRun takes, in order - in plain language, so you can adjust anything.
-
WebRun signs in and gets to work
Opens
static.practicefusion.com/apps/ehrin a real browser with your saved login - no setup, no API keys. -
1
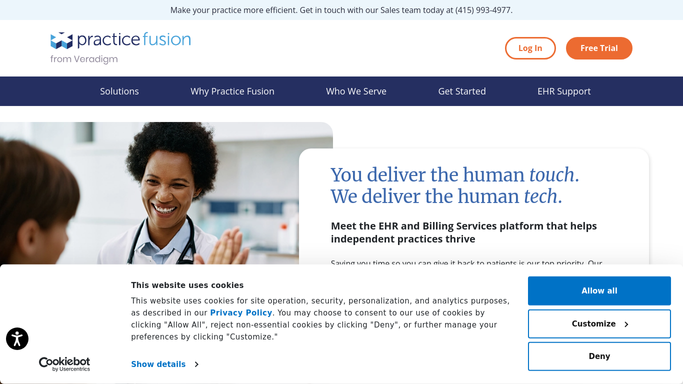
Practice Fusion - read prior week appointment data by provider
practicefusion.com How to Automate Practice Fusion

WebRun opens Practice Fusion to read prior week appointment data by provider. - Open Practice Fusion and navigate to the prior week's appointment schedule
- Read appointment status for each slot by provider: completed, no-show, cancelled, or rescheduled
- Calculate booked utilization as completed appointments divided by total available slots
- Break down appointment type mix: new patient consults, immunotherapy shots, skin tests, biologic visits, telemedicine, and follow-ups
- Note any provider with utilization below 70 percent for the week
Done when Utilization rate, no-show rate, and appointment type mix are calculated for each active provider for the prior week.
-
2
Google Sheets - log per-provider utilization metrics for trend tracking
google.com How to Automate Google Sheets
WebRun opens Google Sheets to log per-provider utilization metrics for trend tracking. - Open the provider utilization tracking Google Sheet
- Append a weekly row per provider with utilization rate, no-show rate, cancellation rate, and appointment type counts
- Compute a 4-week rolling average for each metric to smooth week-to-week variance
Done when Last week's utilization metrics are logged in the sheet with rolling averages updated.
-
3
Slack - post weekly provider utilization scorecard
slack.com How to Automate Slack
WebRun opens Slack to post weekly provider utilization scorecard. - Post the weekly provider utilization scorecard to the management Slack channel
- List each provider with their utilization rate, no-show rate, and top appointment type
- Flag any provider below 70 percent utilization for management attention
- Include the practice total and note if any change in appointment type mix signals demand shifts
Done when Management has the prior week's provider utilization scorecard in Slack with flags for low-utilization providers.


How do I automatically get a weekly allergy provider utilization report from Practice Fusion?
WebRun opens Practice Fusion every Monday and reads the prior week's appointment data for each allergy provider, calculating utilization rate, no-show rate, and appointment type mix. Results are logged to Google Sheets with rolling averages and posted as a provider scorecard to Slack, so management spots scheduling inefficiencies and capacity gaps without pulling a single manual report.
- Management sees each provider's utilization rate every Monday without pulling manual reports
- Providers consistently below 70 percent utilization are flagged before revenue loss compounds
- Appointment type mix trends reveal whether to open more shot slots or consult slots to match demand
Built for allergy clinic managers · practice administrators · allergy and immunology group practices
How is each run configured?
Secure by default
Connect once, stays signed in
WebRun signs in once and keeps each session in a persistent environment, so every run picks up right where it left off.
Every action is checked against this policy before it runs.
Questions, answered
Does it include patient names in the utilization report?
No. The report aggregates appointment counts and rates by provider. No patient-identifiable information appears in the Google Sheet or Slack post. Patient detail stays in Practice Fusion where access is controlled.
What counts as a utilized slot versus an underutilized one?
Completed appointments count as utilized. No-shows, late cancellations, and open unfilled slots count as underutilized. The threshold for a flag is below 70 percent utilization for the week, but you can adjust this when setting up the run.
Can it help identify whether the clinic needs more injection slots versus consult slots?
Yes. The appointment type mix breakdown shows the proportion of shots, consults, new patients, and testing slots completed each week. If the shot-visit share is rising, the report gives management data to add injection-only slots before scheduling becomes a bottleneck.
Related templates
Put this on autopilot.
Turn it on in minutes - or have our team set it up for you.