See which animals are hitting their gain targets
Every Monday, WebRun opens CattleMax and Performance Livestock Analytics, retrieves the latest weight records for each pen or group, calculates average daily gain since the last weigh date, logs the results to a Google Sheet for trend tracking, and posts a performance digest to your ranch Slack channel with underperformers flagged.
- No credit card
- Under $0.01 per run
- Cancel anytime
What does WebRun do on every run?
The exact actions WebRun takes, in order - in plain language, so you can adjust anything.
-
WebRun signs in and gets to work
Opens
www.cattlemax.comin a real browser with your saved login - no setup, no API keys. -
1
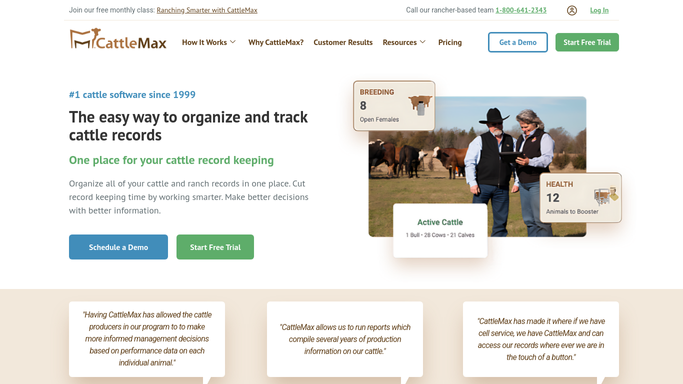
CattleMax - retrieve weight records by pen or group
cattlemax.com How to Automate CattleMax

WebRun opens CattleMax to retrieve weight records by pen or group. - Open CattleMax and navigate to the Weight Records section
- Retrieve the two most recent weigh dates for each pen or group
- Capture current weight, previous weight, and number of days between weighings for each animal or group
Done when Weight records for all active pens or groups are retrieved with the data needed to calculate gain.
-
2
Performance Livestock Analytics - pull benchmark and market data
performancelivestock.com
WebRun opens Performance Livestock Analytics to pull benchmark and market data. - Open Performance Livestock Analytics and check benchmark average daily gain for your region and weight class
- Note the current market value per pound of gain for context
- Capture any cost-of-gain estimates relevant to your operation
Done when Benchmark and market reference data is captured for performance comparison.
-
3
Google Sheets - calculate and log average daily gain
google.com How to Automate Google Sheets
WebRun opens Google Sheets to calculate and log average daily gain. - Open the weight gain tracking spreadsheet
- Calculate average daily gain for each pen or group using current weight, previous weight, and days on feed
- Compare each group against your target daily gain and the regional benchmark
- Flag groups more than 10 percent below target as underperformers
- Append the week's results to the historical log
Done when All groups have calculated ADG, variance from target, and performance status logged.
-
4
Slack - post weekly performance digest
slack.com How to Automate Slack
WebRun opens Slack to post weekly performance digest. - Post the weekly weight gain performance digest to the ranch operations Slack channel
- List underperforming pens first with their ADG shortfall and days on feed
- Include a summary table of all groups ranked by average daily gain
Done when Ranch team has the weekly performance report in Slack.



How do I get a weekly cattle weight gain performance report automatically?
Every Monday, WebRun retrieves the latest weight records from CattleMax for each pen or group, calculates average daily gain since the last weigh date, benchmarks each group against regional standards in Performance Livestock Analytics, and posts a ranked performance digest to Slack with underperforming pens flagged for immediate attention.
- Underperforming pens identified each week before they fall further behind target
- ADG trends logged automatically for end-of-closeout margin analysis
- Ranch team gets a ranked performance digest every Monday without manual spreadsheet work
Built for feedlot operators · stocker cattle ranchers · cow-calf producers · livestock performance managers
How is each run configured?
Secure by default
Connect once, stays signed in
WebRun signs in once and keeps each session in a persistent environment, so every run picks up right where it left off.
Every action is checked against this policy before it runs.
Questions, answered
How does it define an underperformer?
By default it flags any pen or group more than 10 percent below your configured target average daily gain. You can adjust that threshold when setting up the workflow.
Does it need weights entered manually each week?
No. It reads weight records directly from CattleMax as you log them. The workflow uses whichever two most recent weigh dates are already in your records.
Can it compare my results against industry benchmarks?
Yes. WebRun pulls regional benchmark data from Performance Livestock Analytics and includes it in the report so you can see how your pens compare to market standards.
Related templates
Put this on autopilot.
Turn it on in minutes - or have our team set it up for you.