See exactly how well your imaging slots are being used
Every Monday, WebRun opens RamSoft, compiles last week's scheduled, completed, and no-show studies by modality, calculates utilization and no-show rates, logs the data to Google Sheets, and sends a weekly utilization digest to your management Telegram group so capacity decisions can be made before the schedule for the following week is finalized.
- No credit card
- Under $0.01 per run
- Cancel anytime
What does WebRun do on every run?
The exact actions WebRun takes, in order - in plain language, so you can adjust anything.
-
WebRun signs in and gets to work
Opens
www.ramsoft.comin a real browser with your saved login - no setup, no API keys. -
1
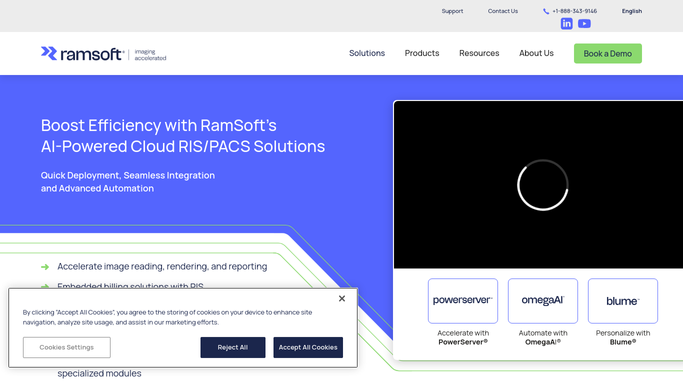
RamSoft - compile scheduled, completed, and no-show counts by modality
ramsoft.com How to Automate RamSoft

WebRun opens RamSoft to compile scheduled, completed, and no-show counts by modality. - Open RamSoft and pull last week's appointment data grouped by modality
- Count scheduled, completed, cancelled, and no-show exams for each modality
- Calculate utilization rate (completed / scheduled) and no-show rate for each modality
- Compare to the prior week to identify improving or declining modalities
Done when Last week's utilization and no-show rates are calculated for all modalities.
-
2
Google Sheets - calculate and log utilization rates
google.com How to Automate Google Sheets
WebRun opens Google Sheets to calculate and log utilization rates. - Append this week's utilization data to the Scheduling Utilization Tracker sheet
- Highlight any modality below the target utilization threshold
- Update the 4-week rolling average columns
Done when The Google Sheet is current with this week's modality utilization rates and rolling averages.
-
3
Telegram - send weekly utilization digest to management group
telegram.org How to Automate Telegram
WebRun opens Telegram to send weekly utilization digest to management group. - Send the weekly utilization digest to the management Telegram group
- Lead with overall facility utilization, then break out by modality with week-over-week change
- Flag any modality below 70% utilization for capacity review
Done when Management has the weekly utilization digest in Telegram before Monday morning planning.


How do I automatically report imaging slot utilization by modality each week?
WebRun compiles last week's scheduling data from RamSoft every Monday, calculates utilization and no-show rates for each modality, and logs the results to Google Sheets before sending a digest to your management Telegram group. Leaders see which modalities are underbooked and can adjust capacity for the week ahead before the schedule is locked.
- Management sees modality utilization before Monday's capacity planning meeting
- Underbooked modalities flagged automatically so slots can be opened before the schedule fills
- 4-week rolling average in Google Sheets reveals seasonal patterns for proactive staffing
Built for imaging center managers · radiology department directors · outpatient imaging administrators
How is each run configured?
Secure by default
Connect once, stays signed in
WebRun signs in once and keeps each session in a persistent environment, so every run picks up right where it left off.
Every action is checked against this policy before it runs.
Questions, answered
Can it recommend capacity changes automatically?
WebRun surfaces the data and flags underperforming modalities, but capacity decisions such as opening or closing slots are made by your scheduling manager. The digest gives them the information; the action stays with the human.
What utilization threshold triggers a flag?
The default threshold is 70% slot utilization per modality, but you can configure it to match your center's targets during setup. Any modality below that threshold is highlighted in both the Google Sheet and the Telegram message.
Does it include revenue impact of unused slots?
Yes, if you configure an average revenue per slot by modality during setup, WebRun can calculate the estimated revenue impact of underutilization and include it in the Telegram digest for financial context.
Related templates
Put this on autopilot.
Turn it on in minutes - or have our team set it up for you.