Keep a weekly record of what your Groq usage costs
Every Monday, WebRun opens the Groq console, reads last week's requests, tokens, and spend broken down by API key, writes one dated row per key into Airtable, and posts a short Notion note showing how the week compares with the weeks before it.
- No credit card
- Under $0.01 per run
- Cancel anytime
How do I track my Groq API usage and cost each week?
WebRun opens the Groq console every Monday and reads the last seven days of requests, tokens, and spend, split by API key. It writes a dated row per key into Airtable with cost per thousand tokens, then posts a short Notion note showing how the week's volume and spend compare with previous weeks.
- A quiet climb in spend is visible before the invoice arrives
- Cost sits next to volume every week, not just at billing time
- Spend split by API key so you know which project drives it
Built for engineering leads · AI product teams · startup founders · platform engineers
What does WebRun do on every run?
The exact actions WebRun takes, in order - in plain language, so you can adjust anything.
-
WebRun signs in and gets to work
Opens
console.groq.comin a real browser with your saved login - no setup, no API keys. -
1
Groq - read usage and billing
groq.com
WebRun opens Groq to read usage and billing. - Open the Groq console and go to usage for the last seven days
- Capture request count and token totals, split by API key where the console shows it
- Open billing and read the spend recorded for the same period
- Note anything unusual, such as a key with no traffic or a day well above the rest
Done when Last week's requests, tokens, and spend have been read from the console.
-
2
Airtable - write the week's row
airtable.com How to Automate Airtable
WebRun opens Airtable to write the week's row. - Open your usage base and add a dated row for the week
- Fill in requests, tokens, and spend per API key
- Add a cost per thousand tokens column so efficiency is comparable across weeks
- Leave earlier rows untouched so the history builds up
Done when This week's usage and cost are recorded in Airtable next to the previous weeks.
-
3
Notion - post the trend
notion.so How to Automate Notion
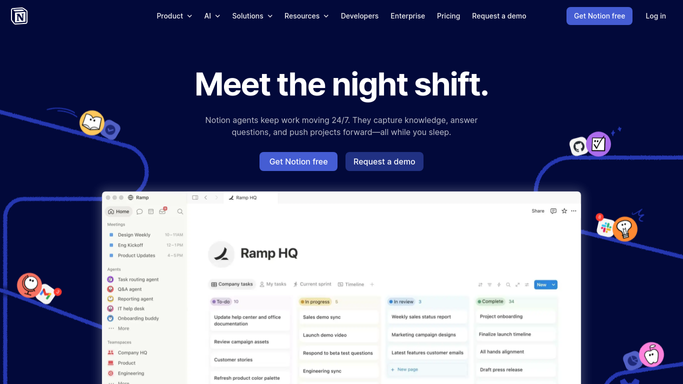
WebRun opens Notion to post the trend. - Post a short note to your engineering page with this week's totals
- Show the change against the previous week in both volume and spend
- Call out any key whose share of spend moved sharply
Done when The team can see this week's spend and how it moved.
How is each run configured?
Secure by default
Connect once, stays signed in
WebRun signs in once and keeps each session in a persistent environment, so every run picks up right where it left off.
Every action is checked against this policy before it runs.
Questions, answered
Does it change anything in my Groq account?
No. WebRun only reads the usage and billing pages in the console. It never creates or revokes an API key, changes a plan, edits a limit, or makes any payment.
Why record it weekly instead of reading the dashboard?
Because the console shows the current period, not the shape of the last six months. A dated Airtable row per week turns a moving number into a trend you can plot before the invoice explains it.
Can it split spend by API key?
Yes, wherever the Groq console reports usage per key. Each key gets its own row, so you can see which project or environment is driving the week's cost.
Related templates
Put this on autopilot.
Turn it on in minutes - or have our team set it up for you.