See which distributors are actually selling through
Every Monday, WebRun opens Ekos, pulls each distributor's depletion volume, product sold through to retail, for the trailing 30 days, checks it against invoiced shipments in QuickBooks to separate real sell through from unsold stock sitting in a warehouse, logs the trend to a running Google Sheet, and posts a depletion report to Slack ranking distributors from strongest to weakest.
- No credit card
- Under $0.01 per run
- Cancel anytime
What does WebRun do on every run?
The exact actions WebRun takes, in order - in plain language, so you can adjust anything.
-
WebRun signs in and gets to work
Opens
app.goekos.comin a real browser with your saved login - no setup, no API keys. -
1
Ekos - pull trailing 30 day depletion volume by distributor
goekos.com How to Automate Ekos

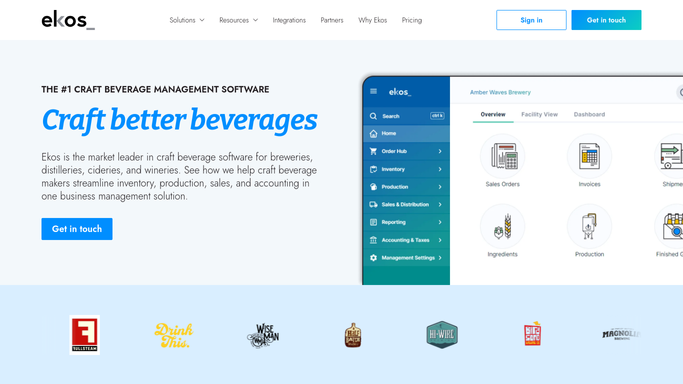
WebRun opens Ekos to pull trailing 30 day depletion volume by distributor. - Open Ekos and go to distributor depletion or sell through reporting
- Pull each distributor's depletion volume by brand for the trailing 30 days
- Note any distributor with no depletion activity logged in the period
Done when Every distributor has a trailing 30 day depletion volume by brand.
-
2
QuickBooks - check depletion against invoiced shipments
- Open QuickBooks and pull invoiced shipment volume to each distributor for the same period
- Compare shipped volume against depleted volume to estimate unsold stock sitting in the warehouse
Done when Every distributor's shipped volume has been checked against its depleted volume.
-
3
Google Sheets - log the depletion trend
google.com How to Automate Google Sheets
WebRun opens Google Sheets to log the depletion trend. - Open the distributor depletion tracking sheet
- Add this period's depletion, shipped volume, and estimated unsold stock for each distributor
- Update the rolling trend chart so slow movers show up over time
Done when This period's figures are logged and the rolling trend is current.
-
4
Slack - post the ranked depletion report
slack.com How to Automate Slack
WebRun opens Slack to post the ranked depletion report. - Post the depletion report to your sales channel
- Rank distributors from strongest to weakest depletion, with estimated unsold stock alongside
- Flag any distributor with a growing gap between shipped and depleted volume
Done when Sales has a ranked depletion report in Slack with slow movers flagged.


How do I know which distributors are actually selling through?
WebRun pulls each distributor's trailing 30 day depletion volume from Ekos every Monday, checks it against invoiced shipments in QuickBooks to spot unsold stock sitting in a warehouse, logs the trend to Google Sheets, and posts a ranked Slack report, so your sales team knows which distributors are truly selling through and which need a conversation.
- Underperforming distributors surface weekly instead of at the annual review
- Unsold stock sitting in a distributor warehouse gets flagged before it goes stale
- Depletion trend history builds automatically for every distributor conversation
Built for craft breweries · sales directors · distribution managers · brewery owners
How is each run configured?
Secure by default
Connect once, stays signed in
WebRun signs in once and keeps each session in a persistent environment, so every run picks up right where it left off.
Every action is checked against this policy before it runs.
Questions, answered
What is the difference between shipped volume and depletion?
Shipped volume is what you invoiced to the distributor in QuickBooks. Depletion is what the distributor actually sold through to retail in Ekos. A growing gap between the two means stock is sitting unsold in their warehouse.
Does it contact underperforming distributors directly?
No. It only posts an internal Slack report ranking distributors for your sales team. Reaching out to a distributor about slow depletion stays a decision your team makes.
How far back does the trend go?
Each report covers the trailing 30 days, and the Google Sheet keeps a rolling history so you can see whether a distributor's depletion is improving or sliding over time.
Related templates
Put this on autopilot.
Turn it on in minutes - or have our team set it up for you.