See which rental units are earning their keep every week
Every Monday, WebRun opens ASPEN, pulls last week's days-out and rental hours for every unit in the rental fleet, calculates each unit's utilization rate against its target, checks the rental revenue QuickBooks recorded for the week, and logs a ranked utilization report to Google Sheets so you can see which units are earning their keep and which are not.
- No credit card
- Under $0.01 per run
- Cancel anytime
What does WebRun do on every run?
The exact actions WebRun takes, in order - in plain language, so you can adjust anything.
-
WebRun signs in and gets to work
Opens
aspendealers.comin a real browser with your saved login - no setup, no API keys. -
1
ASPEN (Charter Software) - pull days-out and hours for every rental unit
aspendealers.com How to Automate ASPEN (Charter Software)

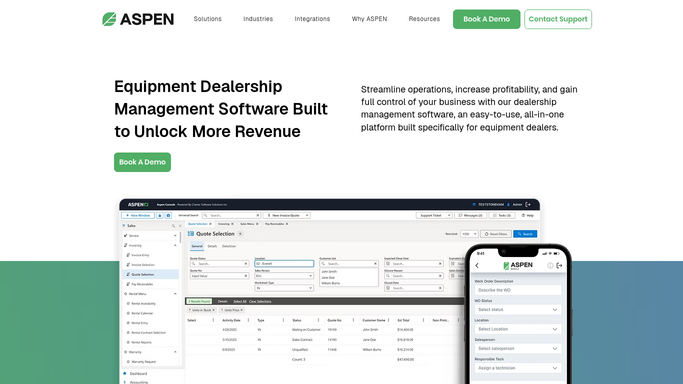
WebRun opens ASPEN (Charter Software) to pull days-out and hours for every rental unit. - Open ASPEN Rental Management and pull last week's days-out and hours for every unit in the fleet
- Calculate each unit's utilization rate as days rented against days available
- Flag units under 40 percent utilization for two consecutive weeks
Done when Every rental unit's utilization rate for the week is calculated, with chronic underperformers flagged.
-
2
QuickBooks - check rental revenue posted for the week
- Look up the rental revenue posted for each unit or fleet class for the week
- Note any unit generating revenue below its typical weekly average
Done when Weekly rental revenue is matched to each fleet class in QuickBooks.
-
3
Google Sheets - log the ranked utilization report
google.com How to Automate Google Sheets
WebRun opens Google Sheets to log the ranked utilization report. - Log this week's utilization rate and revenue for every unit to the rental fleet tracker
- Rank units from highest to lowest utilization, with chronic underperformers highlighted
Done when The rental fleet tracker in Google Sheets reflects this week's ranked utilization report.

How do I see which rental equipment units are underperforming each week?
WebRun pulls each rental unit's days-out and hours from ASPEN every Monday, calculates its utilization rate, checks the rental revenue QuickBooks posted for the week, and logs a ranked report to Google Sheets, flagging any unit under 40 percent utilization for two straight weeks so you can decide whether to reprice, relocate, or sell it.
- Underperforming units get flagged after two weeks, not two quarters
- Utilization and revenue sit side by side instead of two separate reports
- Fleet decisions are based on actual days-out, not gut feel
Built for rental fleet managers · ag equipment dealership owners · rental department coordinators
How is each run configured?
Secure by default
Connect once, stays signed in
WebRun signs in once and keeps each session in a persistent environment, so every run picks up right where it left off.
Every action is checked against this policy before it runs.
Questions, answered
Does it recommend selling underperforming rental units?
No. WebRun only flags units under 40 percent utilization for two straight weeks. Whether to sell, reprice, or relocate a unit is your call.
How is utilization calculated?
It divides days actually rented by days available for each unit, read straight from ASPEN Rental Management, so the rate reflects real activity, not bookings alone.
Does the revenue figure include damage or late fees?
It reports whatever QuickBooks has posted against that unit or fleet class for the week, which includes any fees your team has already recorded there.
Related templates
Put this on autopilot.
Turn it on in minutes - or have our team set it up for you.