Send your team a weekly support trends report
Every Monday, WebRun pulls last week's ticket data from Freshdesk, calculates key metrics (volume, resolution time, CSAT, top 5 issue types), writes a structured summary to Google Sheets, and posts a highlights digest to your #support-leads Slack channel.
- No credit card
- Under $0.01 per run
- Cancel anytime
How can I automatically generate a weekly support trends report?
Every Monday, WebRun pulls last week's ticket data from Freshdesk, calculates key metrics including volume, resolution time, CSAT, and top issue types, writes a structured summary to Google Sheets, and posts a highlights digest to your Slack #support-leads channel - so your team can spot problems and improve week over week.
- Weekly metrics delivered every Monday without manual data pulling
- Volume, CSAT, and resolution trends visible in Google Sheets
- Team leadership gets a digest in Slack before the weekly review
Built for support team leads · customer experience managers · SaaS companies · operations managers
What does WebRun do on every run?
The exact actions WebRun takes, in order - in plain language, so you can adjust anything.
-
WebRun signs in and gets to work
Opens
freshdesk.comin a real browser with your saved login - no setup, no API keys. -
1
Freshdesk - pull last week's ticket metrics
freshdesk.com
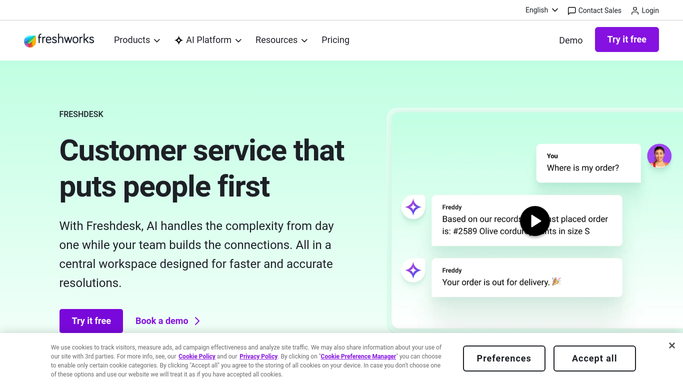
WebRun opens Freshdesk to pull last week's ticket metrics. - Open Reports and set the date range to the previous Monday-Sunday
- Record: total tickets, resolved tickets, average first-response time, average resolution time, and CSAT score
- List the top 5 ticket categories by volume for the week
Done when All key weekly metrics and top issue categories are captured.
-
2
Google Sheets - write the weekly summary row
google.com How to Automate Google Sheets

WebRun opens Google Sheets to write the weekly summary row. - Open the Support Trends sheet and append a new weekly row with this week's date and all metrics
- Highlight any metric that has worsened more than 10% vs the prior week
- Update the rolling 4-week chart ranges so the chart auto-refreshes
Done when The weekly row is added and any regressions are highlighted.
-
3
Slack - post the highlights digest
slack.com How to Automate Slack

WebRun opens Slack to post the highlights digest. - Post a digest to #support-leads: headline metrics for the week and any metrics that regressed vs the prior week
- Include a link to the Sheets dashboard for the full breakdown
Done when Support leads have the weekly digest and a sheet link in Slack.
How is each run configured?
Secure by default
Connect once, stays signed in
WebRun signs in once and keeps each session in a persistent environment, so every run picks up right where it left off.
Every action is checked against this policy before it runs.
Questions, answered
Can I add custom metrics to the report?
Yes - add a column to the Sheets template and tell WebRun what Freshdesk report field to map it to. It will populate it every week.
What counts as a 'regression'?
By default, any metric worse than the prior week by more than 10%. You can change that threshold in the plan.
Does it work for multiple support teams?
Yes - configure a separate Freshdesk group filter per team and WebRun can produce a per-team row in the same sheet.
Related templates
Put this on autopilot.
Turn it on in minutes - or have our team set it up for you.