Get a clear weekly view of your solar pipeline
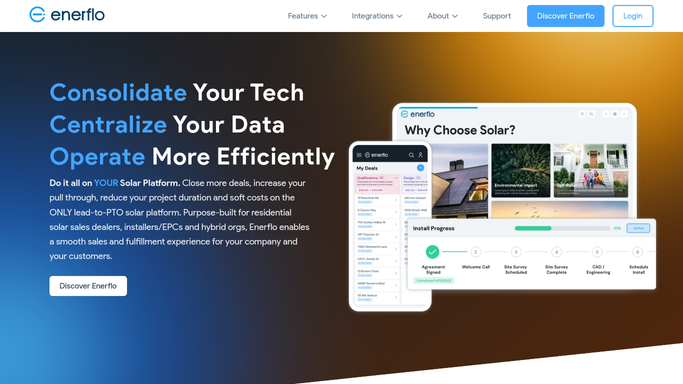
Every Monday morning, WebRun opens Enerflo, reads every active deal across all pipeline stages, counts deals by stage, calculates the total contract value, flags projects that have stalled or are behind schedule, logs the summary to Google Sheets, and posts a concise weekly pipeline report to your team's Slack channel.
- No credit card
- Under $0.01 per run
- Cancel anytime
What does WebRun do on every run?
The exact actions WebRun takes, in order - in plain language, so you can adjust anything.
-
WebRun signs in and gets to work
Opens
enerflo.comin a real browser with your saved login - no setup, no API keys. -
1
Enerflo - read pipeline and deal data
enerflo.com How to Automate Enerflo

WebRun opens Enerflo to read pipeline and deal data. - Open Enerflo and navigate to the full active pipeline view
- Count the number of deals in each stage: lead, proposal sent, contract signed, permit submitted, installed, and PTO
- Sum the total contract value across all open deals
- Identify projects with no activity in the last 5 or more days and count them as stalled
- Note how many new leads were added and how many installs were completed this week
Done when The pipeline counts, total value, new leads, completed installs, and stalled project count are all captured.
-
2
Google Sheets - log weekly pipeline snapshot
google.com How to Automate Google Sheets
WebRun opens Google Sheets to log weekly pipeline snapshot. - Open the weekly pipeline snapshot sheet
- Add a new row for this week with the date, stage counts, total value, new leads, and stalled count
- This builds a running history so the team can track trends week over week
Done when This week's snapshot is logged as a new row in the pipeline history sheet.
-
3
Slack - post weekly pipeline report
slack.com How to Automate Slack
WebRun opens Slack to post weekly pipeline report. - Post the weekly pipeline report to the sales or ops Slack channel
- Lead with the headline numbers: total active deals, total value, new leads this week, and installs completed
- List the deal count per stage and the number of stalled projects
- Include a link to the full Google Sheets history for anyone who wants the detail
Done when The team has the weekly pipeline report in Slack at the start of the work week.


How do I automatically generate a weekly solar pipeline report?
WebRun opens Enerflo every Monday morning and reads the full pipeline: deal counts by stage, total contract value, new leads, completed installs, and stalled projects. It logs the snapshot to a Google Sheets history and posts a concise report to Slack, so the whole team starts the week with the same clear view of where the funnel stands.
- The team starts every Monday with an accurate pipeline snapshot without anyone pulling data manually
- Stalled projects and pipeline trends are visible week over week in the Google Sheets history
- Leadership can see total contract value and install velocity at a glance
Built for solar sales managers · residential solar installers · solar company owners
How is each run configured?
Secure by default
Connect once, stays signed in
WebRun signs in once and keeps each session in a persistent environment, so every run picks up right where it left off.
Every action is checked against this policy before it runs.
Questions, answered
Does it change anything in Enerflo or make any updates?
No. WebRun only reads pipeline data from Enerflo. It never changes a deal stage, updates a record, or takes any action inside Enerflo.
Can it break the report down by rep or team?
The default report covers the full pipeline. During setup you can ask WebRun to add a per-rep breakdown if your Enerflo data includes rep assignment.
How far back does the Google Sheets history go?
It adds a new row every Monday from the day you start the workflow. There is no automatic data deletion, so the history grows as long as you run it.
Related templates
Put this on autopilot.
Turn it on in minutes - or have our team set it up for you.