Show your community the lives your shelter saved this month
On the first day of each month, WebRun opens Shelterluv, pulls the prior month's adoption count, rescue intake, live release rate, and animal outcome figures, compiles them into a structured impact report in Google Sheets, and posts a summary to the leadership Slack channel.
- No credit card
- Under $0.01 per run
- Cancel anytime
What does WebRun do on every run?
The exact actions WebRun takes, in order - in plain language, so you can adjust anything.
-
WebRun signs in and gets to work
Opens
www.shelterluv.comin a real browser with your saved login - no setup, no API keys. -
1
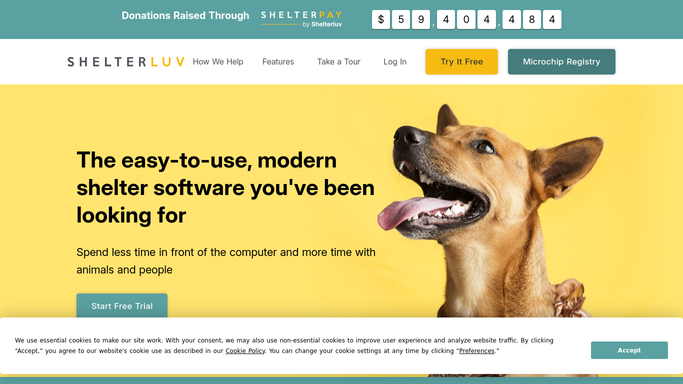
Shelterluv - pull prior month outcomes and adoption figures
shelterluv.com How to Automate Shelterluv

WebRun opens Shelterluv to pull prior month outcomes and adoption figures. - Open Shelterluv and navigate to the reporting or outcomes dashboard
- Filter records to the prior calendar month
- Read the total intake count, adoptions, returns to owner, transfers, live release rate, and any euthanasia figures
- Break down adoptions by species such as dogs, cats, and small animals
Done when All key outcome figures for the prior month are captured.
-
2
Google Sheets - compile the monthly impact report
google.com How to Automate Google Sheets
WebRun opens Google Sheets to compile the monthly impact report. - Open the monthly impact report sheet in Google Sheets
- Append a new section with the prior month's date and all captured figures
- Calculate the live release rate and month-over-month change if prior month data is present
- Highlight any figures that improved or declined significantly compared to the previous month
Done when The monthly impact report is compiled and appended to the Google Sheets log.
-
3
Slack - post impact summary to leadership
slack.com How to Automate Slack
WebRun opens Slack to post impact summary to leadership. - Post a one-page impact summary to the leadership Slack channel
- Lead with total adoptions, live release rate, and month-over-month change
- Include a link to the full Google Sheets report for detailed review
Done when Leadership has the monthly impact summary in Slack with a link to the full report.


How do I automatically generate a monthly adoptions and impact report for my shelter?
On the first day of each month, WebRun opens Shelterluv, pulls the prior month's adoption count, live release rate, intake, and outcome figures, compiles them into a structured report in Google Sheets, and posts a headline summary to the leadership Slack channel. Leadership gets a clear monthly picture of impact without anyone manually pulling and formatting data.
- Leadership receives a consistent monthly impact report without manual data pulling
- Month-over-month trends are calculated automatically for quick benchmarking
- The Google Sheets log is ready to drop into grant applications or board presentations
Built for animal shelter directors · rescue organisation leadership · shelter board members · humane society managers
How is each run configured?
Secure by default
Connect once, stays signed in
WebRun signs in once and keeps each session in a persistent environment, so every run picks up right where it left off.
Every action is checked against this policy before it runs.
Questions, answered
Does it publish or share the report publicly without staff review?
No. The report is posted internally to the leadership Slack channel and the Google Sheets log. Any public sharing is done manually by staff after review.
Which outcome metrics does it include in the report?
By default: total intake, adoptions by species, returns to owner, transfers, live release rate, and month-over-month change. You can add or remove metrics to match your reporting requirements.
Can the report be used for grant applications or board reporting?
Yes. The Google Sheets report is structured so it can be copied directly into grant templates or board packs. The running monthly log also supports trend charts.
Related templates
Put this on autopilot.
Turn it on in minutes - or have our team set it up for you.