Get a monthly enrollment and revenue snapshot without pulling reports yourself
On the first of every month, WebRun opens Jackrabbit Class, pulls enrollment counts by class level, capacity utilization, tuition collected, and outstanding balances, logs the data to a Google Sheet for your records, and posts a clean management summary to Slack so leadership sees the numbers without touching a report.
- No credit card
- Under $0.01 per run
- Cancel anytime
What does WebRun do on every run?
The exact actions WebRun takes, in order - in plain language, so you can adjust anything.
-
WebRun signs in and gets to work
Opens
app.jackrabbitclass.comin a real browser with your saved login - no setup, no API keys. -
1
Jackrabbit Class - pull enrollment, capacity, and revenue figures
jackrabbitclass.com

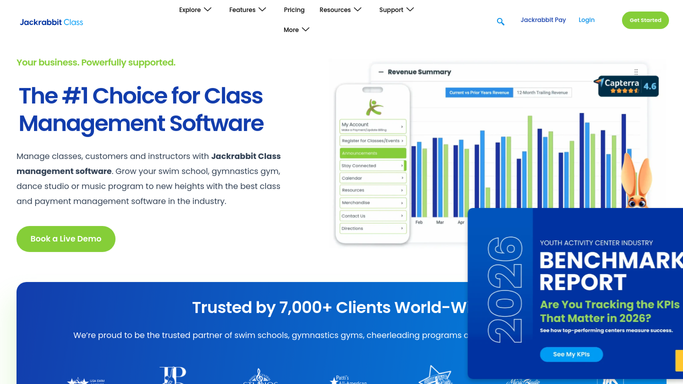
WebRun opens Jackrabbit Class to pull enrollment, capacity, and revenue figures. - Open Jackrabbit Class and navigate to the reports or enrollment section
- Pull total active enrollments for the month, broken down by class level
- Capture capacity utilization as a percentage for each class
- Collect total tuition billed, tuition collected, and outstanding balances for the month
- Note any classes at or above 90 percent capacity as high-demand flags
Done when All enrollment and revenue figures for the month are collected and ready to log.
-
2
Google Sheets - log the monthly data to the enrollment tracker
google.com How to Automate Google Sheets
WebRun opens Google Sheets to log the monthly data to the enrollment tracker. - Open the monthly enrollment tracker Google Sheet
- Append a new row for the current month with enrollments, capacity rates, billed, collected, and outstanding figures
- Highlight any class at over 90 percent capacity so it stands out in the sheet
Done when The current month's data is logged in the Google Sheet with high-demand classes highlighted.
-
3
Slack - post the management summary
slack.com How to Automate Slack
WebRun opens Slack to post the management summary. - Post a formatted monthly summary to the management Slack channel
- Include total enrollments, overall capacity rate, tuition collected, and outstanding balance
- Call out the top three classes by enrollment and any classes with low fill rates
Done when Leadership has a clean monthly snapshot in Slack within minutes of the month starting.


How do I automatically generate a monthly swim school enrollment and revenue report?
WebRun opens Jackrabbit Class on the first of each month, pulls enrollment counts, capacity rates, and tuition collected and outstanding, logs the data to a Google Sheet for long-term tracking, and posts a formatted management summary to Slack so leadership has current numbers without pulling a single report manually.
- Leadership sees enrollment and revenue figures the morning of the first without pulling reports
- Monthly data is logged to Google Sheets for trend analysis and seasonal planning
- High-demand and low-fill classes are flagged automatically for quick action
Built for swim school directors · aquatic program managers · youth sports operations teams · swim lesson business owners
How is each run configured?
Secure by default
Connect once, stays signed in
WebRun signs in once and keeps each session in a persistent environment, so every run picks up right where it left off.
Every action is checked against this policy before it runs.
Questions, answered
Does this report touch any family-facing communications?
No. This is a fully internal report. WebRun only reads data from Jackrabbit Class and writes to your internal Google Sheet and Slack channel. Nothing is sent to families.
Can I see historical trends across multiple months?
Yes. Each monthly run appends a new row to the same Google Sheet, so over time you build a running history that shows enrollment trends and seasonal patterns.
What if I want the report on a different day than the first of the month?
You can change the schedule when you configure the workflow to run on any day you choose, such as the last Friday of each month or the 5th for end-of-month processing.
Related templates
Put this on autopilot.
Turn it on in minutes - or have our team set it up for you.